- Solve equations and inequalities
- Simplify expressions
- Factor polynomials
- Graph equations and inequalities
- Advanced solvers
- All solvers
- Arithmetics
- Determinant
- Percentages
- Scientific Notation
- Inequalities
- Math Articles
- Linear equations

Linear relations and their graphing
LINEAR RELATIONS
In this section we examine one of the simplest types of relations, the linear relation. Every linear relation has a graph that is a straight line, and so we need only find two points on the graph in order to sketch it. Examples of linear relations are y=2x+3 , y=x and 3x + 2y = 6
LINEAR RELATION A linear relation in two variables is a relation that can be written in the form
y=ax+b , where a and b are real numbers. Note Linear relations are often written in the form Ax + By = C , where A , B , and C are real, and A and B are not both 0 . This is called the standard form of a linear relation.
In the equation Ax + By = C , any number can be used for x or y , so both the domain and range of a linear relation in which neither A nor B is 0 are the set of real numbers (-inf,inf) ,
GRAPHING LINEAR RELATIONS . The graph of a linear relation can be found by plotting at least two points. Two points that are especially useful for sketching the graph of a line are found with the intercepts. An x -intercept is an x -value at which a graph crosses the x -axis. A y -intercept is a y -value at which a graph crosses the y-axis. Since y = 0 on the x-axis, an x-intercept is found by setting y equal to 0 in the equation and solving for x . Similarly, a y -intercept is found by setting x=0 in the equation and solving for y .
Example 1 GRAPHING A LINEAR RELATION USING INTERCEPTS
Graph 3x + 2y = 6 . Use the intercepts. The y -intercept is found by letting x=0 . 3.0+2y=6
2y=6
y=3 For the x -intercept, let y=0 , getting
3x+2.0=6 3x=6 x=2 . Plotting (0,3) and (2,0) gives the graph in Figure 3.7. A third point could be found as a check if desired.

Let’s see how our math solver generates graphs of this and similar problems. Click on "Solve Similar" button to see more examples.
Example 2 GRAPHING HORIZONTAL AND VERTICAL LINES
(a) Graph y=-3 .
Since y always equals -3 , the value of y can never be 0 . This means that the graph has no x -intercept. The only way a straight line can have no x -intercept is for it to be parallel to the x -axis, as shown in Figure 3.8. Notice that the domain of this linear relation is (-inf,inf) but the range is {-3} .

(b) Graph x=-3 .
Here, since x always equals -3 , the value of x can never be 0 , and the graph has no y -intercept. Using reasoning similar to that of part (a), we find that this graph is parallel to the y -axis, as shown in Figure 3.9. The domain of this relation is {-3} , while the range is (-inf,inf) ,
From this example we may conclude that a linear relation of the form y=k has as its graph a horizontal line through (0,k) , and one of the form x=k has as its graph a vertical line through (k,0) .

Example 3 GRAPHING A LINE THROUGH THE ORIGIN
Graph 4x-5y=0 ,
Find the intercepts. If x=0 , then 4(0)-5y=0
Letting y=0 leads to the same ordered pair, 0=0 . The graph of this relation has just one intercept—at the origin. Find another point by choosing a different value for x (or y ). Choosing x=5 gives 4(5)-5y=0
20-5y=0
20=5y
4=y which leads to the ordered pair (5,4) . Complete the graph using the two points (0,0) and (5,4) , with a third point as a check. See Figure 3.10.

Let’s see various graphs of line passing through origin. Click on "Solve Similar" button to see more examples.
SLOPE An important characteristic of a straight line is its slope, a numerical measure of the steepness of the line. (Geometrically, this may be interpreted as the ratio of rise to run.) To find this measure, start with the line through the two distinct points (x_1,y_1) and (x_2,y_2) , as shown in Figure 3.11 , where (x_1!=x_2) .The difference (x_2-y_1)

is called the change in x and denoted by {Delta}(x) (read “delta x ’), where {Delta} is the Greek letter delta. In the same way, the change in y can be written
{Delta}y=y_2-y_1
The slope of a nonvertical line is defined as the quotient of the change in y and the change in x , as follows.
SLOPE The slope m of the line through the points (x_1,y_1) and (x_2,y_2) is
m=({Delta}y)/({Delta}x)=(y_2-y_1)/(x_2-x_1)
Where {Delta}(x)!=0
CAUTION When using the slope formula, be sure that it is applied correctly. It makes no difference which point is (x_1,y_1) or (x_2,y_2) ; however, it is important to be consistent. Start with the x - and y -value of one point (either one) and subtract the corresponding values of the other point.
The slope of a line can be found only if the line is nonvertical. This guarantees that (x_2!=x_1) , so that the denominator (x_2-x_1)!=0 . It is not possible to define the slope of a vertical line.
The slope of a vertical line is undefined.
Example 4.FINDING SLOPES WITH THE SLOPE FORMULA
Find the slope of the line through each of the following pairs of points.
(a) (-4, 8), (2, -3) Let x_1=-4 , y_1=8 , and x_2=-2 , y_2=-3 . Then
{Delta}y=-3-8=-11
and x{Delta}=2-(-4)=6
The Slope is m=({Delta}y)/({Delta}x)=-11/6
(b) (2, 7), (2, -4)
A sketch would show that the line through (2, 7) and (2, -4) is vertical. As mentioned above, the slope of a vertical line is not defined. (An attempt to use the definition of slope here would produce a zero denominator.)
(c) (5, -3) and (-2, -3)
By definition of slope, m=(-3-(-3))/(-2-5)=0/-7=0
Drawing a graph through the points in Example 4(c) would produce a line that is horizontal, which suggests the following generalization.
The slope of a horizontal line is 0.
Figure 3.12 shows lines of various slopes. As the figure shows, a line with a positive slope goes up from left to right, but a line with a Positive slope negative slope goes down from left to right.
It can be shown, using theorems for similar triangles, that the slope slope is independent of the choice of points on the line. That is, the slope of a line is the same no matter which pair of distinct points on the line are used to find it.
Since the slope of a line is the ratio of vertical change to horizontal change, if we know the slope of a line and the coordinates of a point on the line, the graph of the line can be drawn. The next example illustrates this.

Example 5 GRAPHING A LINE USING A POINT AND THE SLOPE
Graph the line passing through (-1,5) and having slope -5/3 . First locate the point (-1,5) as shown in Figure 3.13. Since the slope of this line is -5/3 , a change of -5 units vertically (that is, 5 units down) produces a change of 3 units horizontally ( 3 units to the right).
This gives a second point, (2,0) , which can then be used to complete the graph.
Because -5/3=5/(-3) , another point could be obtained by starting at (-1,5) and moving 5 units up and 3 units to the left. We would reach a different second point, but the line would be the same.

EQUATIONS OF A LINE Since equations can define relations, we now consider methods of finding equations of linear relations. Figure 3.14 shows the line passing through the fixed point (x_1,y_1) and having slope m . (Assuming that the line has a slope guarantees that it is not vertical.) Let (x,y) be any other point on the line. By the definition of slope, the slope of the line is (y-y_1)/(x-x_1) Since the slope of the line is m , (y-y_1)/(x-x_1)=m Multiplying both sides by x-x_1 gives y-y_1=m(x-x_1)

This result, called the point-slope form of the equation of a line, identifies points on a given line: a point (x,y) lies on the line through (x_1,y_1) with slope m if and only if y-y_1=m(x-x_1) POINT-SLOPE FORM The line with slope m passing through the point (x_1,y_1) has an equation
y-y_1=m(x-x_1)
the point-slope form of the equation of a line. Example 6 USING THE POINT-SLOPE FORM (GIVEN A POINT AND THE SLOPE)
Write an equation of the line through (-4,1) with slope -3 .
Here x_1=-4 , y_1=1 , and m=-3 . Use the point-slope form of the equation of a line to get
y-1=-3[x-(-4) x_1=-4 y_1=1 m=-3
y-1=-3(x+4)
y-1=-3x-12) Distributive property
or 3x+y=-11
in standard form.
CAUTION The definition of “standard form” is not standard from one text to another. Any linear equation can be written in many different (all equally correct) forms. For example, the equation 2x+3y=8 can be written as 2x=8-3y , 3y=8-2x , x+3/2y=4 , 4x+6y=16 and so on. In addition to writing it in the form Ax + By = C (with A>=0 ), let us agree that the form 2x+3y=8 is preferred over any multiples of both sides, such as 4x+6y=16 .
Example 7 USING THE POINT-SLOPE FORM (GIVEN TWO POINTS)
Find an equation of the line through (-3,2) and (2,-4) Find the slope first. By the definition of slope, m=(-4-2)/(2-(-3))=-6/5
Either (-3,2) or (2,-4) can be used for (x_1,y_1) . Choosing (x_1=-3 and (y_1=2 in the point-slope form gives y-2=-6/5[x-(-3) 5(y-2)=-6(x+3) Multiply by 5. 5y-10=-6x-18 Distributive property
(6x+5y=-8 Standard form
Verify that the same equation results if (2,-4) is used instead of (-3,2) in the Point-slope form.
As a special case of the point-slope form of the equation of a line, suppose that a line passes through the point (0, b) , so the line has y -intercept b . If the line has slope m , then using the point-slope form with x_1=0 and y_1=b gives y-y_1=m(x-x_1)
y-b=m(x-0)
y=mx+b as an equation of the line. Since this result Shows the slope of the line and the y -intercept, it is called the slope-intercept form of the equation of the line.
SLOPE-INTERCEPT FORM The line with slope m and y -intercept b has an equation y=mx+b the slope-intercept form of the equation of a line. Example 8 USING THE SLOPE-INTERCEPT FORM TO GRAPH A LINE
Find the slope and y -intercept of 3x-y=2 Graph the line using this information.
First write 3x-y=2 in the slope-intercept form, y=mx+b , by solving for y , getting 3x-y=2 . This result shows that the Slope is m=3 and the y -intercept is b=-2 . To draw the graph, first locate the y -intercept. See Figure 3.15. Then, as in Example 5, use the slope of 3 , or 3/1 , to get a second point on the graph. The line through these two points is the graph of 3x-y=2 .

In the preceding discussion, it was assumed that the given line had a slope. The only lines having undefined slope are vertical lines. The vertical line through the point (a, b) passes through all the points of the form (a, y) , for any value of y . This fact determines the equation of a vertical line. EQUATION OF A VERTICAL LINE An equation of the vertical line through the point (a, b) is x=a For example, the vertical line through (-4,9) has equation x=-4 , while the vertical line through (0,1/4) has equation x=0 . (This is the y -axis.)
The horizontal line through the point (a, b) passes through all points of the form (x, b) , for any value of x . Therefore, the equation of a horizontal line involves only the variable y . EQUATION OF A HORIZONTAL LINE An equation of the horizontal line through the point (a, b) is y=b .
For example, the horizontal line through (1,-3) has the equation y=-3 . See Figure 3.8 for the graph of this equation. The equation of the x -axis is y=0 .
PARALLEL. AND PERPENDICULAR LINES Slopes can be used to decide whether or not two lines are parallel. Since two parallel lines are equally “steep,” they should have the same slope. Also, two distinct lines with the same “steepness” are parallel. The following result summarizes this discussion.
PARALLEL LINES Two distinct non vertical lines are parallel if and only if they have the same slope. Slopes are also used to determine if two lines are perpendicular. Whenever two lines have slopes with a product of -1 , the lines are perpendicular. PERPENDICULAR LINES Two lines, neither of which is vertical, are perpendicular if and only if their slopes have a product of -1 .
For example, if the slope of a line is -3/4 , the slope of any line perpendicular to it is 4/3 , since (-3/4)(4/3)=-1 . We often refer to numbers like -3/4 and 4/3 as “negative reciprocals.” A proof of this result is outlined in Exercises 63-66.
USING THE SLOPE RELATIONSHIPS FOR PARALLEL AND PERPENDICULAR
Find the equation of the line that passes through the point (3,5) and satisfies the given condition.
(a) parallel to the line 2x+5y=4 Since it is given that the point (3,5) is on the line, we need only find the slope to use the point-slope form. Find the slope by writing the equation of the given line in slope-intercept form. (That is, solve for y .) 2x+5y=4
y=-2/5x+4/5 The slope is -2/5 . Since the lines are parallel, -2/5 is also the slope of the line whose equation is to be found. Substituting m=-2/5 , x_1=3 , and y_1=5 into the point-slope form gives
y-y_1=m(x-x_1)
y-5=-2/5(x-3)
5(y-5)=-2(x-3)
5y-25)=-2x+6
2x+5y=31
(b) perpendicular to the line 2x+5y=4 In part (a) it was found that the slope of this line is -2/5 , so the slope of any line perpendicular to it is 5/2 . Therefore, use m=5/2 , x_1=3 , and y_1=5 in the point-slope form. y-5=5/2(x-3)
2(y-5)=5(x-30
2y-10=5x-15
-5x+2y=-5
or 5x-2y=5
All the lines discussed above have equations that could be written in the form
Ax + By = C for real numbers A , B , and C . As mentioned earlier, the equation Ax + By = C is the standard form of the equation of a line. The various forms of linear equations are listed below.
LINER EQUATIONS
PROBLEM SOLVING
A straight line is often the best approximation of a set of data points that result from a real situation. If the equation is known, it can be used to predict the value of one variable, given a value of the other. For this reason, the equation is written as a linear relation in slope-intercept form. One way to find the equation of such a straight line is to use two typical data points and the point-slope form of the equation of a line.
Example 10 FINDING AN EQUATION FROM DATA POINTS
Scientists have found that the number of chirps made by a cricket of a particular Species per minute is almost linearly related to the temperature. Suppose that for a particular species, at 68 °F a cricket chirps 124 times per minute, while at 80 ° F the cricket chirps 172 times per minute. Find the linear equation that relates the number of chirps to the temperature.
Think of the ordered pairs in the relation as (chirps, temperature), or (c, t) . Then c takes on the role of x and t takes on the role of y . Since we are using a linear relationship, find the slope of the line by using the slope formula with the points (124,68) and (172,80) . m=(68-80)/(124-172)=-12/-48=1/4 Choose one of the points, say (124,68) , and substitute into the point-slope form, with m=1/4 . t-68=1/4(c-124)
t-68=1/4c-31 t=1/4c+37 The equation is t=1/4c+37 . By substituting the number of chirps per minute into this equation, the temperature t can be approximated.
Math Topics
More solvers.
- Add Fractions
- Simplify Fractions
GRAPHING RELATIONSHIPS WORKSHEET
Problems 1-2 : Use the diagram shown below to answer.

Problem 1 :
The air temperature was constant for several hours at the beginning of the day and then rose steadily for several hours. It stayed the same temperature for most of the day before dropping sharply at sundown. Choose the graph above that best represents this situation.
Problem 2 :
The air temperature increased steadily for several hours and then remained constant. At the end of the day, the temperature increased slightly again before dropping sharply. Choose the graph above that best represents this situation.
Problems 3-4 : Sketch a graph for each situation. Tell whether the graph is continuous.
Problem 3 :
David is selling candles to raise money for the school dance. For each candle he sells, the school will get $2.50. He has 10 candles that he can sell.
Problem 4 :
Monica’s heart rate is being monitored while she exercises on a treadmill. While walking, her heart rate remains the same. As she increases her pace, her heart rate rises at a steady rate. When she begins to run, her heart rate increases more rapidly and then remains high while she runs. As she decreases her pace, her heart rate slows down and returns to her normal rate.
Problems 5-6 : Write a possible situation for the given graph.
Problem 5 :

Problem 6 :

Detailed Answer Key
1. Answer :
Step 1 :
Read the graphs from left to right to show time passing.
List key words in order and decide which graph shows them.
Segment Description
Was constant
Graphs A and B
Rose steadily
Slanting upward
Stayed the same
Dropped sharply
Slanting downward

The correct graph is B.
2. Answer :
Increased steadily
Slanting upward
Remained constant
Increased slightly
Slanting upward
Dropping sharply
Slanting downward

The correct graph is C.
3. Answer :
The amount earned (y-axis) increases by $2.50 for each candle Simon sells (x-axis).
Because David can only sell whole numbers of candles, the graph is 11 distinct points.

The graph is discrete.
4. Answer :
As time passes during her workout (moving left to right along the x-axis), her heart rate ( y-axis) does the following :
• remains the same ,
• rises at a steady rate ,
• increases more rapidly (steeper than previous segment),
• remains high ,
• slows down ,
• and then returns to her normal rate .

The graph is continuous.
5. Answer :
Identify labels.
x-axis : time y-axis: water level
Analyze sections.
Over time, the water level
• increases steadily ,
• remains unchanged ,
• and then decreases steadily .
Possible Situation :
A watering can is filled with water . It sits for a while until some flowers are planted. The water is then emptied on top of the planted flowers.
6. Answer :
x-axis : servings
y-axis : calories
Calorie increases for every increase in serving.
The more servings you have of a food or drink, the more calories you consume. Serving size and calories go hand-in-hand. Be sure to look at both of these on food labels and make the healthy choice!

Apart from the stuff given above, if you need any other stuff in math, please use our google custom search here.
Kindly mail your feedback to [email protected]
We always appreciate your feedback.
© All rights reserved. onlinemath4all.com
- Sat Math Practice
- SAT Math Worksheets
- PEMDAS Rule
- BODMAS rule
- GEMDAS Order of Operations
- Math Calculators
- Transformations of Functions
- Order of rotational symmetry
- Lines of symmetry
- Compound Angles
- Quantitative Aptitude Tricks
- Trigonometric ratio table
- Word Problems
- Times Table Shortcuts
- 10th CBSE solution
- PSAT Math Preparation
- Privacy Policy
- Laws of Exponents
Recent Articles
Honors Algebra 2 Problems on Solving Exponential Equations
Mar 30, 24 11:45 PM
Properties of Parallelograms Worksheet
Mar 30, 24 09:11 PM

Division by Zero
Mar 30, 24 08:11 AM
Curriculum / Math / 8th Grade / Unit 5: Linear Relationships / Lesson 8
Linear Relationships
Lesson 8 of 15
Criteria for Success
Tips for teachers, anchor problems, problem set, target task, additional practice.
Graph linear equations using slope-intercept form $${y = mx + b}$$ .
Common Core Standards
Core standards.
The core standards covered in this lesson
Expressions and Equations
8.EE.B.6 — Use similar triangles to explain why the slope m is the same between any two distinct points on a non-vertical line in the coordinate plane; derive the equation y = mx for a line through the origin and the equation y = mx + b for a line intercepting the vertical axis at b.
8.F.A.3 — Interpret the equation y = mx + b as defining a linear function, whose graph is a straight line; give examples of functions that are not linear. For example, the function A = s² giving the area of a square as a function of its side length is not linear because its graph contains the points (1,1), (2,4) and (3,9), which are not on a straight line.
Foundational Standards
The foundational standards covered in this lesson
8.G.A.1 — Verify experimentally the properties of rotations, reflections, and translations:
The essential concepts students need to demonstrate or understand to achieve the lesson objective
- Understand that the lines of equations $${y=mx}$$ and $${y=mx}+b$$ have the same slope $$m$$ .
- Understand that $${y=mx}+b$$ is the translation of the line $$ {y=mx}$$ by a vertical distance $$b$$ .
- Define $${y=mx}+b$$ as the slope-intercept form of a linear equation where $$m$$ represents slope and $$b$$ represents the value of the $$y$$ -intercept .
- Identify the slope and $$y$$ -intercept of an equation in form $${y=mx}+b$$ , and use them to draw the line that represents the equation.
Suggestions for teachers to help them teach this lesson
In Lesson 8, students are introduced to the slope-intercept form of a linear equation, and they see how it is derived from the proportional equation $${y=mx}$$ . They use this form as an efficient way to draw the graph of a linear equation. In Lesson 9, students will encounter equations in standard form, $${ax+by=c}$$ , and they will write these equations into slope-intercept form to graph them.
Lesson Materials
- Patty paper (transparency paper) (1 sheet per student)
- Ruler (1 per student)
Unlock features to optimize your prep time, plan engaging lessons, and monitor student progress.
Problems designed to teach key points of the lesson and guiding questions to help draw out student understanding
Two linear equations are shown below. Complete the table of values for each one and graph the lines in the same coordinate plane. Then answer the questions that follow.
a. $${y=2x}$$ is a proportional relationship represented by a line through the origin (0, 0). In $${y=2x}+3$$ , what impact does the “+3” have on the table of values? What impact does it have on the lines in the graph? What transformation is this?
b. What is the $$y$$ -value of the $$y$$ -intercept of each line? Where do you see this in the equations?
c. What is the slope of each line? Where do you see this in the equations?
d. Describe the graph of the line $${y=2x}-3$$ .
Guiding Questions
For each linear equation below, identify the slope and $$y$$ -intercept and use them to graph the line.
a. $$y={1\over3} x-2$$
b. $$y=-3x+4$$
c. $$y=-x$$
A set of suggested resources or problem types that teachers can turn into a problem set
Give your students more opportunities to practice the skills in this lesson with a downloadable problem set aligned to the daily objective.
A task that represents the peak thinking of the lesson - mastery will indicate whether or not objective was achieved
In each problem below, determine if the linear equation is correctly graphed in the coordinate plane. If it is not, then describe the error and draw the correct graph in the space provided.

Student Response
The following resources include problems and activities aligned to the objective of the lesson that can be used for additional practice or to create your own problem set.
- Include problems where students match an equation to a graph by matching slope and $$y$$ -intercepts.
- Open Up Resources Grade 8 Unit 3 Practice Problems — Lesson 8
- Kuta Software Free Pre-Algebra Worksheets Graphing Lines using Slope-Intercept Form — Do not include horizontal or vertical lines.
- EngageNY Mathematics Grade 8 Mathematics > Module 4 > Topic C > Lesson 18 — Exercises and Problem Set
Topic A: Comparing Proportional Relationships
Review representations of proportional relationships.
Graph proportional relationships and interpret slope as the unit rate.
Compare proportional relationships represented as graphs.
Compare proportional relationships represented in different ways.
Create a free account to access thousands of lesson plans.
Already have an account? Sign In
Topic B: Slope and Graphing Linear Equations
Graph a linear equation using a table of values.
Define slope and determine slope from graphs.
Determine slope from coordinate points. Find slope of horizontal and vertical lines.
8.EE.B.6 8.F.B.4
8.EE.B.6 8.F.A.3
Write equations into slope-intercept form in order to graph. Graph vertical and horizontal lines.
Topic C: Writing Linear Equations
Write linear equations from graphs in the coordinate plane.
Write linear equations using slope and a given point on the line.
Write linear equations using two given points on the line.
Write linear equations for parallel and perpendicular lines.
Compare linear functions represented in different ways.
8.F.A.2 8.F.B.4
Model real-world situations with linear relationships.
Request a Demo
See all of the features of Fishtank in action and begin the conversation about adoption.
Learn more about Fishtank Learning School Adoption.
Contact Information
School information, what courses are you interested in, are you interested in onboarding professional learning for your teachers and instructional leaders, any other information you would like to provide about your school.

Effective Instruction Made Easy
Access rigorous, relevant, and adaptable math lesson plans for free
- Anatomy & Physiology
- Astrophysics
- Earth Science
- Environmental Science
- Organic Chemistry
- Precalculus
- Trigonometry
- English Grammar
- U.S. History
- World History
... and beyond
- Socratic Meta
- Featured Answers

- Problem Solving with Linear Graphs
Key Questions
I assume that the equation you would be creating is in slope-intercept form , or #y= mx + b# .
If so, there is a simple answer. You can tell that you need to create a linear equation by the information the problem gives you. The problem should list the Y- intercept, a starting amount of something and a slope , or a rate of change.
For example, here is a problem:
Maddie and Cindy are starting their very own babysitting business. They charge parents $5 dollars right when they come in and $2 for every hour they need to babysit a child. How can they calculate how much they will charge for an evening of babysitting?
Your formula would be: #y= 2x + 5#
Your #x# value would be hour(s) and your #y# value would be total cost. After you write your equation you can simply solve it.

- school Campus Bookshelves
- menu_book Bookshelves
- perm_media Learning Objects
- login Login
- how_to_reg Request Instructor Account
- hub Instructor Commons
- Download Page (PDF)
- Download Full Book (PDF)
- Periodic Table
- Physics Constants
- Scientific Calculator
- Reference & Cite
- Tools expand_more
- Readability
selected template will load here
This action is not available.
6.2: Relations and Functions
- Last updated
- Save as PDF
- Page ID 143066

Learning Objectives
By the end of this section, you will be able to:
- Find the domain and range of a relation
- Determine if a relation is a function
- Find the value of a function
Find the Domain and Range of a Relation
As we go about our daily lives, we have many data items or quantities that are paired to our names. Our social security number, student ID number, email address, phone number and our birthday are matched to our name. There is a relationship between our name and each of those items.
When your professor gets her class roster, the names of all the students in the class are listed in one column and then the student ID number is likely to be in the next column. If we think of the correspondence as a set of ordered pairs, where the first element is a student name and the second element is that student’s ID number, we call this a relation .
\[(\text{Student name}, \text{ Student ID #})\nonumber \]
The set of all the names of the students in the class is called the domain of the relation and the set of all student ID numbers paired with these students is the range of the relation.
There are many similar situations where one variable is paired or matched with another. The set of ordered pairs that records this matching is a relation.
Definition: Relation
A relation is any set of ordered pairs, \((x,y)\). All the x -values in the ordered pairs together make up the domain . All the y -values in the ordered pairs together make up the range .
Example \(\PageIndex{1}\)
For the relation \({(1,1),(2,4),(3,9),(4,16),(5,25)}\):
- Find the domain of the relation.
- Find the range of the relation.
\[\begin{array} {ll} {} &{ {\{(1,1), (2,4), (3,9), (4,16), (5,25) }\} } \\ {ⓐ\text{ The domain is the set of all x-values of the relation.}} &{ {\{1,2,3,4,5}\} } \\ {ⓑ\text{ The range is the set of all y-values of the relation.}} &{ {\{1,4,9,16,25}\} } \\ \nonumber \end{array}\]
Example \(\PageIndex{2}\)
For the relation \({\{(1,1),(2,8),(3,27),(4,64),(5,125)}\}\):
\({\{1,2,3,4,5}\}\)
\({\{1,8,27,64,125}\}\)
Example \(\PageIndex{3}\)
For the relation \({\{(1,3),(2,6),(3,9),(4,12),(5,15)}\}\):
\({\{3,6,9,12,15}\}\)
A mapping is sometimes used to show a relation. The arrows show the pairing of the elements of the domain with the elements of the range.
Example \(\PageIndex{4}\)
Use the mapping of the relation shown to
- list the ordered pairs of the relation,
- find the domain of the relation, and
- find the range of the relation.

ⓐ The arrow shows the matching of the person to their birthday. We create ordered pairs with the person’s name as the x -value and their birthday as the y -value.
{(Alison, April 25), (Penelope, May 23), (June, August 2), (Gregory, September 15), (Geoffrey, January 12), (Lauren, May 10), (Stephen, July 24), (Alice, February 3), (Liz, August 2), (Danny, July 24)}
ⓑ The domain is the set of all x -values of the relation.
{Alison, Penelope, June, Gregory, Geoffrey, Lauren, Stephen, Alice, Liz, Danny}
ⓒ The range is the set of all y -values of the relation.
{January 12, February 3, April 25, May 10, May 23, July 24, August 2, September 15}
Example \(\PageIndex{5}\)
- list the ordered pairs of the relation
- find the domain of the relation

ⓐ (Khanh Nguyen, kn68413), (Abigail Brown, ab56781), (Sumantha Mishal, sm32479), (Jose Hern and ez, jh47983)
ⓑ {Khanh Nguyen, Abigail Brown, Sumantha Mishal, Jose Hern and ez}
ⓒ {kn68413, ab56781, sm32479, jh47983}
Example \(\PageIndex{6}\)

ⓐ (Maria, November 6), (Arm and o, January 18), (Cynthia, December 8), (Kelly, March 15), (Rachel, November 6)
ⓑ {Maria, Arm and o, Cynthia, Kelly, Rachel}
ⓒ{November 6, January 18, December 8, March 15}
A graph is yet another way that a relation can be represented. The set of ordered pairs of all the points plotted is the relation. The set of all x -coordinates is the domain of the relation and the set of all y -coordinates is the range. Generally we write the numbers in ascending order for both the domain and range.
Example \(\PageIndex{7}\)
Use the graph of the relation to

ⓐ The ordered pairs of the relation are: \[{\{(1,5),(−3,−1),(4,−2),(0,3),(2,−2),(−3,4)}\}.\nonumber\]
ⓑ The domain is the set of all x -values of the relation: \(\quad {\{−3,0,1,2,4}\}\).
Notice that while \(−3\) repeats, it is only listed once.
ⓒ The range is the set of all y -values of the relation: \(\quad {\{−2,−1,3,4,5}\}\).
Notice that while \(−2\) repeats, it is only listed once.
Example \(\PageIndex{8}\)

a. \((−3,3),(−2,2),(−1,0),\), \((0,−1),(2,−2),(4,−4)\)
b. \({\{−3,−2,−1,0,2,4}\}\)
c. \({\{3,2,0,−1,−2,−4}\}\)
Example \(\PageIndex{9}\)

ⓐ \((−3,0),(−3,5),(−3,−6),\) \((−1,−2),(1,2),(4,−4)\) ⓑ \({\{−3,−1,1,4}\}\) ⓒ \({\{−6,0,5,−2,2,−4}\}\)
Determine if a Relation is a Function
A special type of relation, called a function , occurs extensively in mathematics. A function is a relation that assigns to each element in its domain exactly one element in the range. For each ordered pair in the relation, each x -value is matched with only one y -value.
Definition: Function
A function is a relation that assigns to each element in its domain exactly one element in the range.
The birthday example from Example helps us understand this definition. Every person has a birthday but no one has two birthdays. It is okay for two people to share a birthday. It is okay that Danny and Stephen share July 24 th as their birthday and that June and Liz share August 2 nd . Since each person has exactly one birthday, the relation in Example is a function.
The relation shown by the graph in Example includes the ordered pairs \((−3,−1)\) and \((−3,4)\). Is that okay in a function? No, as this is like one person having two different birthdays.
Example \(\PageIndex{10}\)
Use the set of ordered pairs to (i) determine whether the relation is a function (ii) find the domain of the relation (iii) find the range of the relation.
- \({\{(−3,27),(−2,8),(−1,1),(0,0),(1,1),(2,8),(3,27)}\}\)
- \({\{(9,−3),(4,−2),(1,−1),(0,0),(1,1),(4,2),(9,3)}\}\)
ⓐ \({\{(−3,27),(−2,8),(−1,1),(0,0),(1,1),(2,8),(3,27)}\}\)
(i) Each x -value is matched with only one y -value. So this relation is a function.
(ii) The domain is the set of all x -values in the relation. The domain is: \({\{−3,−2,−1,0,1,2,3}\}\).
(iii) The range is the set of all y -values in the relation. Notice we do not list range values twice. The range is: \({\{27,8,1,0}\}\).
ⓑ \({\{(9,−3),(4,−2),(1,−1),(0,0),(1,1),(4,2),(9,3)}\}\)
(i) The x -value 9 is matched with two y -values, both 3 and \(−3\). So this relation is not a function.
(ii) The domain is the set of all x -values in the relation. Notice we do not list domain values twice. The domain is: \({\{0,1,2,4,9}\}\).
(iii) The range is the set of all y -values in the relation. The range is: \({\{−3,−2,−1,0,1,2,3}\}\).
Example \(\PageIndex{11}\)
Use the set of ordered pairs to (i) determine whether the relation is a function (ii) find the domain of the relation (iii) find the range of the function.
- \({\{(−3,−6),(−2,−4),(−1,−2),(0,0),(1,2),(2,4),(3,6)}\}\)
- \({\{(8,−4),(4,−2),(2,−1),(0,0),(2,1),(4,2),(8,4)}\}\)
ⓐ Yes; \({\{−3,−2,−1,0,1,2,3}\}\); \({\{−6,−4,−2,0,2,4,6}\}\) ⓑ No; \({\{0,2,4,8}\}\); \({\{−4,−2,−1,0,1,2,4}\}\)
Example \(\PageIndex{12}\)
- \({\{(27,−3),(8,−2),(1,−1),(0,0),(1,1),(8,2),(27,3)}\}\)
- \({\{(7,−3),(−5,−4),(8,−0),(0,0),(−6,4),(−2,2),(−1,3)}\}\)
ⓐ No; \({\{0,1,8,27}\}\); \({\{−3,−2,−1,0,2,2,3}\}\) ⓑ Yes; \({\{7,−5,8,0,−6,−2,−1}\}\); \({\{−3,−4,0,4,2,3}\}\)
Example \(\PageIndex{13}\)
Use the mapping to
- determine whether the relation is a function
ⓐ Both Lydia and Marty have two phone numbers. So each x -value is not matched with only one y -value. So this relation is not a function.
ⓑ The domain is the set of all x -values in the relation. The domain is: {Lydia, Eugene, Janet, Rick, Marty}
ⓒ The range is the set of all y -values in the relation. The range is:
\({\{321-549-3327, 427-658-2314, 321-964-7324, 684-358-7961, 684-369-7231, 798-367-8541}\}\)
Example \(\PageIndex{14}\)
Use the mapping to ⓐ determine whether the relation is a function ⓑ find the domain of the relation ⓒ find the range of the relation.

ⓐ no ⓑ {NBC, HGTV, HBO} ⓒ {Ellen Degeneres Show, Law and Order, Tonight Show, Property Brothers, House Hunters, Love it or List it, Game of Thrones, True Detective, Sesame Street}
Example \(\PageIndex{15}\)
ⓐ No ⓑ {Neal, Krystal, Kelvin, George, Christa, Mike} ⓒ {123-567-4839 work, 231-378-5941 cell, 743-469-9731 cell, 567-534-2970 work, 684-369-7231 cell, 798-367-8541 cell, 639-847-6971 cell}
In algebra, more often than not, functions will be represented by an equation. It is easiest to see if the equation is a function when it is solved for y . If each value of x results in only one value of y , then the equation defines a function.
Example \(\PageIndex{16}\)
Determine whether each equation is a function.
- \(y=x^2+1\)
- \(x+y^2=3\)
ⓐ \(2x+y=7\)
For each value of x , we multiply it by \(−2\) and then add 7 to get the y -value
We have that when \(x=3\), then \(y=1\). It would work similarly for any value of x . Since each value of x , corresponds to only one value of y the equation defines a function.
ⓑ \(y=x^2+1\)
For each value of x , we square it and then add 1 to get the y -value.
We have that when \(x=2\), then \(y=5\). It would work similarly for any value of x . Since each value of x , corresponds to only one value of y the equation defines a function.
We have shown that when \(x=2\), then \(y=1\) and \(y=−1\). It would work similarly for any value of x . Since each value of x does not corresponds to only one value of y the equation does not define a function.
Example \(\PageIndex{17}\)
- \(4x+y=−3\)
- \(x+y^2=1\)
- \(y−x^2=2\)
ⓐ yes ⓑ no ⓒ yes
Example \(\PageIndex{18}\)
- \(x+y^2=4\)
- \(y=x^2−7\)
- \(y=5x−4\)
ⓐ no ⓑ yes ⓒ yes
Find the Value of a Function
It is very convenient to name a function and most often we name it f , g , h , F , G , or H . In any function, for each x -value from the domain we get a corresponding y -value in the range. For the function \(f\), we write this range value \(y\) as \(f(x)\). This is called function notation and is read \(f\) of \(x\) or the value of \(f\) at \(x\). In this case the parentheses does not indicate multiplication.
Definition: Function Notation
For the function \(y=f(x)\)
\[\begin{array} {l} {f\text{ is the name of the function}} \\{x \text{ is the domain value}} \\ {f(x) \text{ is the range value } y \text{ corresponding to the value } x} \\ \nonumber \end{array}\]
We read \(f(x)\) as \(f\) of \(x\) or the value of \(f\) at \(x\).
We call x the independent variable as it can be any value in the domain. We call y the dependent variable as its value depends on x .
INDEPENDENT AND DEPENDENT VARIABLES
For the function \(y=f(x)\),
\[\begin{array} {l} {x \text{ is the independent variable as it can be any value in the domain}} \\ {y \text{ the dependent variable as its value depends on } x} \\ \nonumber \end{array}\]
Much as when you first encountered the variable x , function notation may be rather unsettling. It seems strange because it is new. You will feel more comfortable with the notation as you use it.
Let’s look at the equation \(y=4x−5\). To find the value of y when \(x=2\), we know to substitute \(x=2\) into the equation and then simplify.
The value of the function at \(x=2\) is 3.
We do the same thing using function notation, the equation \(y=4x−5\) can be written as \(f(x)=4x−5\). To find the value when \(x=2\), we write:
This process of finding the value of \(f(x)\) for a given value of x is called evaluating the function.
Example \(\PageIndex{19}\)
For the function \(f(x)=2x^2+3x−1\), evaluate the function.
- \(f(−2)\)
Example \(\PageIndex{20}\)
For the function \(f(x)=3x^2−2x+1\), evaluate the function.
- \(f(−1)\)
ⓐ \(f(3)=22\) ⓑ \(f(−1)=6\) ⓒ \(f(t)=3t^2−2t−1\)
Example \(\PageIndex{21}\)
For the function \(f(x)=2x^2+4x−3\), evaluate the function.
- \(f(−3)\)
ⓐ \((2)=13\) ⓑ \(f(−3)=3\) ⓒ \(f(h)=2h2+4h−3\)
In the last example, we found \(f(x)\) for a constant value of x . In the next example, we are asked to find \(g(x)\) with values of x that are variables. We still follow the same procedure and substitute the variables in for the x .
Example \(\PageIndex{22}\)
For the function \(g(x)=3x−5\), evaluate the function.
- \(g(x)+g(2)\)
Notice the difference between part ⓑ and ⓒ. We get \(g(x+2)=3x+1\) and \(g(x)+g(2)=3x−4\). So we see that \(g(x+2)\neq g(x)+g(2)\).
Example \(\PageIndex{23}\)
For the function \(g(x)=4x−7\), evaluate the function.
- \(g(x−3)\)
- \(g(x)−g(3)\)
ⓐ \(4m^2−7\) ⓑ \(4x−19\) ⓒ \(x−12\)
Example \(\PageIndex{24}\)
For the function \(h(x)=2x+1\), evaluate the function.
- \(h(x)+h(1)\)
ⓐ \(2k^2+1\) ⓑ \(2x+3\) ⓒ \(2x+4\)
Many everyday situations can be modeled using functions.
Example \(\PageIndex{25}\)
The number of unread emails in Sylvia’s account is 75. This number grows by 10 unread emails a day. The function \(N(t)=75+10t\) represents the relation between the number of emails, N , and the time, t , measured in days.
- Determine the independent and dependent variable.
- Find \(N(5)\). Explain what this result means.
ⓐ The number of unread emails is a function of the number of days. The number of unread emails, N , depends on the number of days, t . Therefore, the variable N , is the dependent variable and the variable tt is the independent variable.
ⓑ Find \(N(5)\). Explain what this result means.
Since 5 is the number of days, \(N(5)\), is the number of unread emails after 5 days. After 5 days, there are 125 unread emails in the account.
Example \(\PageIndex{26}\)
The number of unread emails in Bryan’s account is 100. This number grows by 15 unread emails a day. The function \(N(t)=100+15t\) represents the relation between the number of emails, N , and the time, t , measured in days.
- Find \(N(7)]\). Explain what this result means.
ⓐ t IND; N DEP ⓑ 205; the number of unread emails in Bryan’s account on the seventh day.
Example \(\PageIndex{27}\)
The number of unread emails in Anthony’s account is 110. This number grows by 25 unread emails a day. The function \(N(t)=110+25t\) represents the relation between the number of emails, N , and the time, t , measured in days.
- Find \(N(14)\). Explain what this result means.
ⓐ t IND; N DEP ⓑ 460; the number of unread emails in Anthony’s account on the fourteenth day
Access this online resource for additional instruction and practice with relations and functions.
- Introduction to Functions
Key Concepts
- f is the name of the function
- x is the domain value
- \(f(x)\) is the range value y corresponding to the value x We read \(f(x)\) as f of x or the value of f at x .
- x is the independent variable as it can be any value in the domain
- y is the dependent variable as its value depends on x
Helping with Math
Graphing Functional Relationships in Mathematics
Introduction.
Graphing functional relationships is an essential skill in mathematics , allowing students to visualize and analyze mathematical relationships between variables. This article covers the basics of graphing functional relationships, key concepts, and real-life applications. It also includes practice tests and frequently asked questions to strengthen understanding and application of the concept.
Grade Appropriateness
Graphing functional relationships is typically introduced in middle school (grades 6-8) and continues to be developed and reinforced throughout high school mathematics courses.
Math Domain
This topic falls under Algebra , which focuses on understanding, analyzing, and representing mathematical relationships, patterns, and functions.
Applicable Common Core Standards
Some relevant Common Core Standards include:
CCSS.MATH.CONTENT.8.F.B.4 : Construct a function to model a linear relationship between two quantities.
CCSS.MATH.CONTENT.HSF.IF.C.7 : Graph functions expressed symbolically and show key features of the graph by hand and using technology.
Definition
Graphing functional relationships involves representing a mathematical function with a graph, which visually represents the relationship between two variables (typically, x and y).
Key Concepts
Function: A relationship between two variables where each input value has a single output value.
Independent variable : The input variable, typically represented as x.
Dependent variable : The output variable, typically represented as y.
Cartesian coordinate system: A two-dimensional plane with x and y axes used to graph functional relationships.
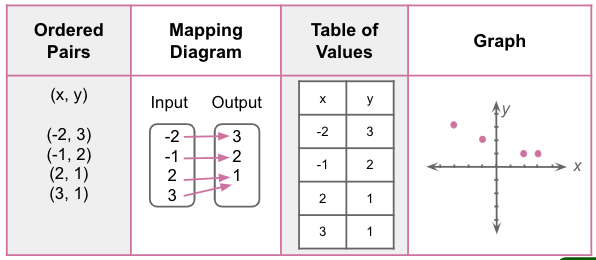
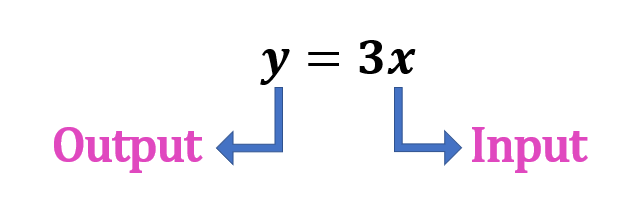
Ordered Pair : A pair of numbers in the form of (x,y) or (input, output). The first number corresponds to the x-coordinate or as an INPUT, and the second number to the y-coordinate or as an OUTPUT.
Domain of a function: The set of all possible input values (x).
Range of a function: The set of all possible output values (y).
Discussion with Illustrative Examples
A set of ordered pairs is referred to as a relation . INPUT and OUTPUT value pairs make up a set.
In the relation, {(1, 4), {-2, 6), (1, 2), (4, -3)},
The domain is {-2, 1, 4}, and the range is {-3, 2, 4, 6}.
Note that we write the same element in the domain or range once.
Ways to Represent Relations
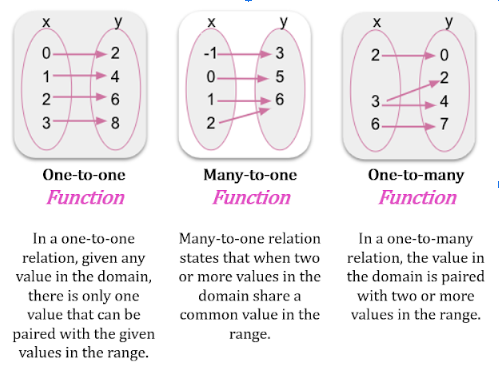
A function is a relation when each element in the domain is paired with exactly one element in the range. Although all relations are functions, not all functions are relations.
Assume that the entire function is shown.
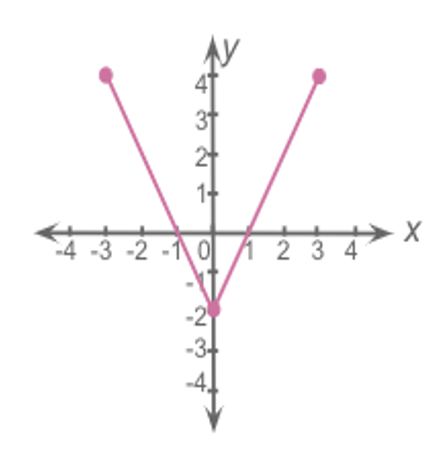
All possible values of x include all numbers from -3 to 3.
Domain: -3 ≤ x ≤ 3
All possible values of y include all numbers from -2 to 4.
Range: -2 ≤ y ≤ 4
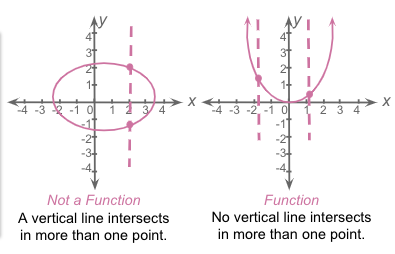
Vertical Line Test
A relation cannot be a function if a vertical line passes more than one point on its graph.
Independent and Dependent Variables
The variable (often x) whose values make up the domain is the independent variable when an equation represents a function.
The other variable (often y), whose values make up the range, is the dependent variable because its values depend on x.
Function Rule
Functions are usually represented by a function rule where you express the dependent variable, y, in terms of the independent variable, x.
Function Notation
If a relation is a function, the “y” in the equation can be replaced with f(x).
f(x) is simply a notation to represent a function. It can be read as ‘f’ of ‘x.’
The x in f(x) tells us that the value of f(x) depends on x.
Functional Relationships
A functional relationship occurs when each y-value can be paired with an x-value.
You can identify functional relationships by looking at the behavior of the graph.
Is it an increasing function? If it is, it must be rising to the right. If it rises to the left, it is a decreasing function.
You may also encounter constant functions. Its graph is neither rising to the left nor the right. It is just a horizontal line.
By looking at the trend of the values of dependent and independent variables, you may describe the functional relationship by saying, for example:
“In every increase in x, f(x) decreases by two.”
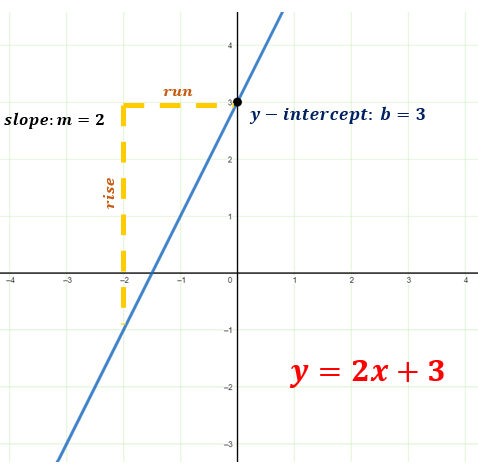
Linear Functions: Represented by the equation y = mx + b, where m denotes the slope and b is the y-intercept. A linear function has a straight line as its graph.
Example: y = 2x + 3
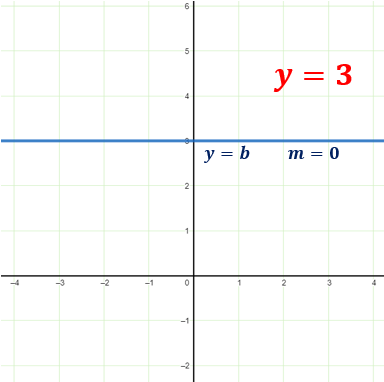
Below is a graph of a constant function where the slope does not change or m=0.
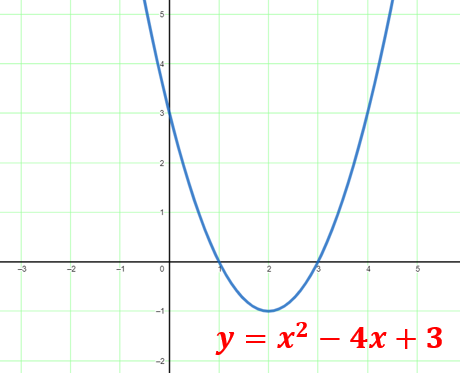
Quadratic Functions: Represented by the equation y = ax 2 + bx + c, where the variables a, b, and c are constants. A parabola shows the graph of a quadratic function.
Example: y = x 2 – 4x + 3
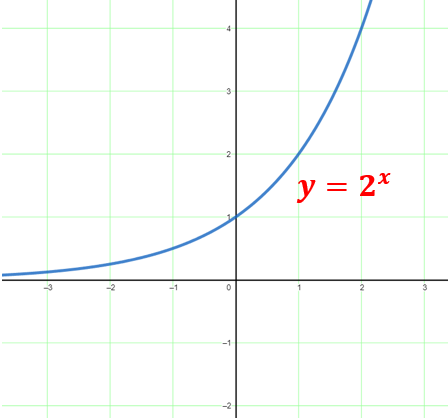
Exponential Functions: Represented by the equation y = ab x , where a≠0 and b>0, b≠1. The graph of an exponential function has a curved shape that increases or decreases rapidly.
The most commonly used exponential function base is the transcendental number e, approximately equal to 2.71828.
Example: y = 2 x
Examples with Solution
Example 1
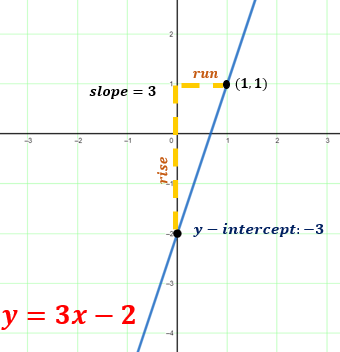
Graph the linear function y = 3x – 2.
Plot the y-intercept (0, -2), and use the slope (3) to find another point (1, 1). Draw a straight line through these points.
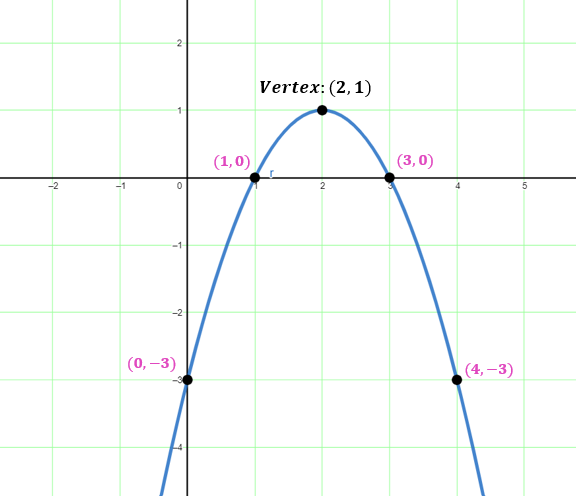
Graph the quadratic function y = -x 2 + 4x – 3.
Solution: Identify the vertex using the formula x = -$\frac{b}{2a}$ , then calculate y.
x=-$\frac{4}{2(-1)}$=2
y=-( 2 ) 2 + 4 ( 2 ) – 3 = 1
Hence the vertex is at (2,1).
Below is the table of values to identify other points of the parabola.
Plot the vertex and other points, then draw a parabola.
Real-life Application with Solution
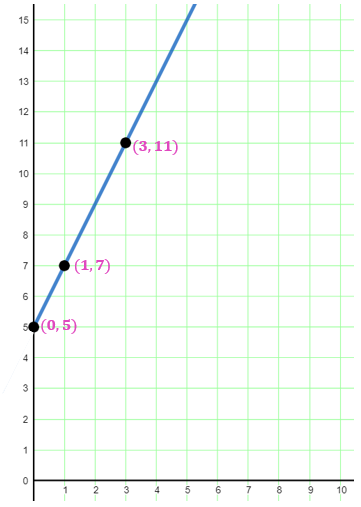
A taxi company charges a $5 flat fee plus $2 per mile. Graph the function representing the cost as a function of miles driven.
The function is y = 2x + 5, which is linear. Plot the y-intercept (0, 5), which represents the flat fee. Use the slope (2) to find another point (1, 7), representing the cost of a 1-mile ride. Draw a straight line through these points. The graph illustrates the relationship between miles driven and the total cost of a taxi ride. So, for a 3-mile ride, a taxi ride costs $11.
There were around 700,000 enslaved people in the US in 1790. Assume that the number increases by 10,000 more each year than the previous.
a. Create a function, f(x), that shows the population of enslaved people in x years after 1790, then graph.
b. Describe the functional relationship shown in the graph.
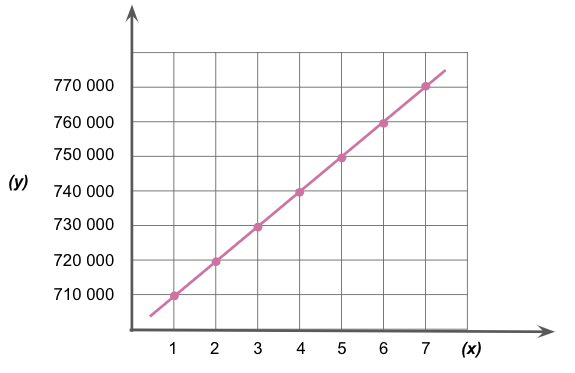
b. The graph rising to the right means that the slope is positive. As the x-value increases, the y-value increases too. Every 1 unit increase in x results in a 10,000 increase in y.
Practice Test
a. Graph the linear function y = -4x + 1.
b. Graph the quadratic function y = x 2 – 6x + 8.
c. Graph the exponential function y = 3 x-1 .
d. Graph the function y = |x – 2|.
e. Graph the function y = ( x – 3 ) 2 + 2.
f. Graph the function y =$\frac{1}{x}$ .
g. Graph the function y = $\sqrt{x}$.
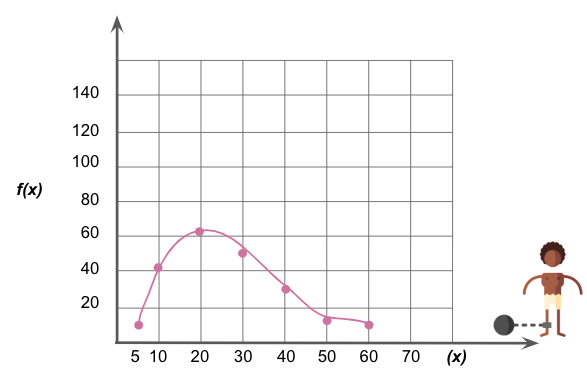
h. The graph below shows the relationship between the average price of enslaved females f(x) and their age (x) in different states along the Atlantic Coasts.
(i) Give the coordinates of the highlighted points of the graph.
(ii) Describe the functional relationship of the graph.
(iii) Provide an interpretation of the given variables.
Frequently Asked Questions (FAQs)
Can all functions be graphed.
Most functions can be graphed, but some functions may have discontinuities or undefined values that make it difficult to represent them visually.
What distinguishes a relation from a function?
A function is a particular type of relation in which each input value has exactly one corresponding output value.
How can I determine if a graph represents a function?
Use the vertical line test: if any vertical line passes through the graph at more than one point, it is not a function.
What is a piecewise function?
A piecewise function is defined by multiple sub-functions, each of which applies to a specific interval of the domain.
How do I graph a function with multiple variables?
Graphing functions with multiple variables require using additional dimensions. For example, a function with three variables (x, y, and z) would be represented on a three-dimensional coordinate system.
Recommended Worksheets
Graphing Functional Relationships (Black History Month Themed) Math Worksheets Graphing Lines in Slope-Intercept Form (Famous African-Americans Themed) Math Worksheets Understanding Basic Concepts of Relations and Functions 8th Grade Math Worksheets
Link/Reference Us
We spend a lot of time researching and compiling the information on this site. If you find this useful in your research, please use the tool below to properly link to or reference Helping with Math as the source. We appreciate your support!
<a href="https://helpingwithmath.com/graphing-functional-relationships/">Graphing Functional Relationships in Mathematics</a>
"Graphing Functional Relationships in Mathematics". Helping with Math . Accessed on April 1, 2024. https://helpingwithmath.com/graphing-functional-relationships/.
"Graphing Functional Relationships in Mathematics". Helping with Math , https://helpingwithmath.com/graphing-functional-relationships/. Accessed 1 April, 2024.
Additional Graphs and Charts Theory:
Latest worksheets.
The worksheets below are the mostly recently added to the site.
Expressing the Sum of Numbers Using Rectangular Array 2nd Grade Math Worksheets

Addition of Three-Digit Numbers (Halloween themed) Worksheets

Comparing Measurement using the SI Unit 2nd Grade Math Worksheets

Different Measuring Tools for Length 2nd Grade Math Worksheets

Understanding Basic Money Denominations 2nd Grade Math Worksheets

Understanding Number Lines 2nd Grade Math Worksheets

Shape Partitions (Rectangles and Circles) 2nd Grade Math Worksheets

Understanding the Metric System Unit of Measurement for Length 2nd Grade Math Worksheets

Naming Numbers Up To 1000 2nd Grade Math Worksheets

Understanding Picture Graph and Bar Graph 2nd Grade Math Worksheets

- → Resources
- → 7th Grade
- → Slope & Rate of Change
Graphing and Interpreting Graphs of Proportional Relationships Lesson Plan
Get the lesson materials.

Represent Proportional Relationships Graphs & Equations Guided Notes w/ Doodles

Ever wondered how to teach proportional relationships in an engaging way to your 7th and 8th grade students?
In this lesson plan, students will learn about representing proportional relationships through graphs and equations and explore their real-life applications. Then, they will also practice interpreting graphs of proportional relationships and understanding what the points represent in the context of the problem. Through artistic and interactive guided notes, checks for understanding, practice activities including a doodle & color by number worksheet, and a maze worksheet, students will gain a comprehensive understanding of proportional relationships.
The lesson culminates with a real-life application example that explores how proportional relationships are used in a practical context. Students will learn how to apply their knowledge of proportional relationships to solve real-world problems .
- Standards : CCSS 8.EE.B.5 , CCSS 7.RP.A.2.a , CCSS 7.RP.A.2.b , CCSS 7.RP.A.2.c , CCSS 7.RP.A.2.d
- Topics : Slope & Rate of Change , Ratio & Rates
- Grades : 7th Grade , 8th Grade
- Type : Lesson Plans
Learning Objectives
After this lesson, students will be able to:
Represent proportional relationships using graphs and equations
Interpret graphs and equations of proportional relationships
Calculate the constant of proportionality from a graph or equation
Calculate unit rates from a graph or equation
Explain the meaning of a point on the graph of a proportional relationship in terms of the situation
Explain how graphing proportional relationships is useful in real life
Prerequisites
Before this lesson, students should be familiar with:
H ow to plot points on a coordinate plane
Basic algebraic skills, including operations with decimals and whole numbers
Colored pencils or markers
Guided notes
Key Vocabulary
Proportional relationship
Constant of proportionality
Introduction

As a hook, ask students why understanding proportional relationships is important in real life. You can provide examples such as determining the amount of time it takes to complete a task, or comparing prices at the grocery store. Refer to the last page of the guided notes as well as the FAQs below for more ideas.
Use the first page of the guided notes to introduce the concept of representing proportional relationships with graphs and equations. Walk through the key points such as understanding what each point on the graph represents in terms of the situation, how to calculate the constant of proportionality & unit rate, and how to construct equations based on the constant of proportionality. You can model using the example of Charlie in space, as shown in the guided notes (page 1).
Based on student responses and understanding, reteach any concepts that students need extra help with. Then, have the students move onto the next page of guided notes (page 2) to practice constructing equations, graphing, interpreting graphs of proportional relationships. If your class has a wide range of proficiency levels, you can pull out students for reteaching, while more advanced students can work on the practice exercises independently.

Have students practice graphing proportional relationships, interpreting graphs, and constructing equations using the maze activity (page 3), and color by number activity (page 4). Students will also be asked to solve for constant of proportionality in the practice. Walk around to answer student questions. You can also assign it as homework.
Real-Life Application

Use the last page of the guided notes (page 5) to bring the class back together, and introduce the concept of real-world application of proportional relationships. Explain to students that proportional relationships can be found in various real-life situations. These situations involve two quantities that change together at a constant rate or ratio.
Give examples of real-world scenarios where proportional relationships can be observed, such as:
Distance and Time: Discuss how the distance travelled is directly proportional to the time spent on the road.
Job Wages: Explain how some jobs pay employees based on the number of hours they work. For example, if a person earns $18 per hour, the amount of money they earn is directly proportional to the number of hours they work. As the number of hours worked increases, their earnings also increase.
Recipes: Share how recipes often require proportional measurements of ingredients. For example, if a recipe calls for 2 cups of flour and 1 cup of sugar, the ratio between flour and sugar remains constant even if the total amount of ingredients increases or decreases.
Ask students if they can think of any other real-life situations that involve proportional relationships. Encourage them to share their ideas with the class.
Refer to the FAQ section in the resource for more ideas on how to teach real-life applications of proportional relationships.
Additional Self-Checking Digital Practice
If you’re looking for digital practice for Representing Proportional Relationships Graphs & Equations, try my Pixel Art activities in Google Sheets. Every answer is automatically checked, and correct answers unlock parts of a mystery picture. It’s incredibly fun, and a powerful tool for differentiation.
Here are some activities to explore:
Graphs of Proportional Relationships Pixel Art
Constant of Proportionality Pixel Art
Proportional vs. Non-Proportional Relationships Pixel Art
Solving Proportions Pixel Art Google Sheets
Additional Print Practice
A fun, no-prep way to practice Representing Proportional Relationships Graphs & Equations is Doodle Math — they’re a fresh take on color by number or color by code. It includes multiple levels levels of practice, perfect for a review day or sub plan.
Here are some activities to try:
Constant of Proportionality Doodle Math (Winter Themed)
Constant of Proportionality Doodle Math (Thanksgiving Themed)
1. What is a proportional relationship? Open
A proportional relationship is a relationship between two quantities where the ratio of one quantity to the other remains constant. In other words, as one quantity increases or decreases, the other quantity increases or decreases by the same factor.
2. How do you represent a proportional relationship graphically? Open
To represent a proportional relationship graphically, you can plot the ordered pairs on a coordinate plane. Each point on the graph represents a pair of values from the proportional relationship. The graph will show a straight line passing through the origin (0, 0), indicating a constant ratio between the two quantities.
3. How do you write an equation for a proportional relationship? Open
To write an equation for a proportional relationship, you can use the formula y = kx, where y represents one quantity, x represents the other quantity, and k represents the constant of proportionality. The constant of proportionality is the ratio between the two quantities that remains constant.
4. What does a point (x, y) on the graph of a proportional relationship mean in terms of the situation? Open
In terms of the situation, a point (x, y) on the graph of a proportional relationship represents a particular combination of values for the two quantities involved. The x-coordinate represents the input or independent variable, while the y-coordinate represents the output or dependent variable. The point shows how the two quantities are related and how they change together.
5. How do you calculate the constant of proportionality? Open
To calculate the constant of proportionality, you can choose any two corresponding values from the proportional relationship. Divide the y-value by the x-value to find the ratio between the two quantities. The resulting ratio will be the constant of proportionality.
6. What is a unit rate? Open
A unit rate is a rate that compares a quantity to one unit of another quantity. It tells you how much of one quantity is associated with one unit of another quantity. For example, if the constant of proportionality is 3, it means that for every 1 unit increase in the independent variable (x), the dependent variable (y) increases by 3 units.
7. What are some real-life applications of proportional relationships? Open
Proportional relationships can be found in various real-life situations. Some examples include:
The relationship between distance and time in speed measurements.
The relationship between the number of workers and the amount of work completed in a fixed amount of time.
The relationship between the number of items purchased and the total cost at a fixed price per item.
8. How can guided notes and doodles help students understand graphing and equations of proportional relationships? Open
Guided notes and doodles are effective teaching tools that engage students and promote active learning. They provide structured notes and visual representations that support students in understanding and retaining the concepts. By including interactive elements like coloring and problem-solving activities, guided notes and doodles make the learning experience enjoyable and memorable for students. They also serve as valuable references for students to refer back to when practicing or reviewing the topic.
Want more ideas and freebies?
Get my free resource library with digital & print activities—plus tips over email.
- SUGGESTED TOPICS
- The Magazine
- Newsletters
- Managing Yourself
- Managing Teams
- Work-life Balance
- The Big Idea
- Data & Visuals
- Reading Lists
- Case Selections
- HBR Learning
- Topic Feeds
- Account Settings
- Email Preferences
Research: How Different Fields Are Using GenAI to Redefine Roles
- Maryam Alavi
Examples from customer support, management consulting, professional writing, legal analysis, and software and technology.
The interactive, conversational, analytical, and generative features of GenAI offer support for creativity, problem-solving, and processing and digestion of large bodies of information. Therefore, these features can act as cognitive resources for knowledge workers. Moreover, the capabilities of GenAI can mitigate various hindrances to effective performance that knowledge workers may encounter in their jobs, including time pressure, gaps in knowledge and skills, and negative feelings (such as boredom stemming from repetitive tasks or frustration arising from interactions with dissatisfied customers). Empirical research and field observations have already begun to reveal the value of GenAI capabilities and their potential for job crafting.
There is an expectation that implementing new and emerging Generative AI (GenAI) tools enhances the effectiveness and competitiveness of organizations. This belief is evidenced by current and planned investments in GenAI tools, especially by firms in knowledge-intensive industries such as finance, healthcare, and entertainment, among others. According to forecasts, enterprise spending on GenAI will increase by two-fold in 2024 and grow to $151.1 billion by 2027 .
- Maryam Alavi is the Elizabeth D. & Thomas M. Holder Chair & Professor of IT Management, Scheller College of Business, Georgia Institute of Technology .
Partner Center
Solving the Multiobjective Quasi-Clique Problem
- Scherer dos Santos, Daniela
- Klamroth, Kathrin
- Martins, Pedro
- Paquete, Luís
Given a simple undirected graph $G$, a quasi-clique is a subgraph of $G$ whose density is at least $\gamma$ $(0 < \gamma \leq 1)$. Finding a maximum quasi-clique has been addressed from two different perspectives: $i)$ maximizing vertex cardinality for a given edge density; and $ii)$ maximizing edge density for a given vertex cardinality. However, when no a priori preference information about cardinality and density is available, a more natural approach is to consider the problem from a multiobjective perspective. We introduce the Multiobjective Quasi-clique Problem (MOQC), which aims to find a quasi-clique by simultaneously maximizing both vertex cardinality and edge density. To efficiently address this problem, we explore the relationship among MOQC, its single-objective counterpart problems, and a biobjective optimization problem, along with several properties of the MOQC problem and quasi-cliques. We propose a baseline approach using $\varepsilon$-constraint scalarization and introduce a Two-phase strategy, which applies a dichotomic search based on weighted sum scalarization in the first phase and an $\varepsilon$-constraint methodology in the second phase. Additionally, we present a Three-phase strategy that combines the dichotomic search used in Two-phase with a vertex-degree-based local search employing novel sufficient conditions to assess quasi-clique efficiency, followed by an $\varepsilon$-constraint in a final stage. Experimental results on real-world sparse graphs indicate that the integrated use of dichotomic search and local search, together with mechanisms to assess quasi-clique efficiency, makes the Three-phase strategy an effective approach for solving the MOQC problem in terms of running time and ability to produce new efficient quasi-cliques.
- Computer Science - Discrete Mathematics;
- Computer Science - Data Structures and Algorithms
IMAGES
VIDEO
COMMENTS
Graphing linear relationships word problems. Google Classroom. Amir drove from Jerusalem down to the lowest place on Earth, the Dead Sea, descending at a rate of 12 meters per minute. He was at sea level after 30 minutes of driving. Graph the relationship between Amir's altitude relative to sea level (in meters) and time (in minutes).
The three main ways to represent a relationship in math are using a table, a graph, or an equation. In this article, we'll represent the same relationship with a table, graph, and equation to see how this works. Example relationship: A pizza company sells a small pizza for $ 6 . Each topping costs $ 2 .
Find the slope and y -intercept of 3 x-y=2 Graph the line using this information. First write 3 x-y=2 in the slope-intercept form, y=mx+b, by solving for y, getting 3 x-y=2. This result shows that the Slope is m=3 and the y -intercept is b=− 2. To draw the graph, first locate the y -intercept.
Graphs, Relations, Domain, and Range. The rectangular coordinate system 1 consists of two real number lines that intersect at a right angle. The horizontal number line is called the x-axis 2, and the vertical number line is called the y-axis 3.These two number lines define a flat surface called a plane 4, and each point on this plane is associated with an ordered pair 5 of real numbers \((x, y)\).
Graph the linear equation y = 2x + 3 y = 2 x + 3. [hidden-answer a="834421″]Evaluate y = 2x + 3 y = 2 x + 3 for different values of x, and create a table of corresponding x and y values. Convert the table to ordered pairs. Plot the ordered pairs. Draw a line through the points to indicate all of the points on the line.
GRAPHING RELATIONSHIPS WORKSHEET. Problems 1-2 : Use the diagram shown below to answer. ... Problems 3-4 : Sketch a graph for each situation. Tell whether the graph is continuous. Problem 3 : ... Honors Algebra 2 Problems on Solving Exponential Equations. Read More. Properties of Parallelograms Worksheet. Mar 30, 24 09:11 PM.
Practice interpreting linear functions, graphing equations, solving word problems, writing equations from tables and other linear concepts. This video revie...
A linear relationship is any relationship between two variables that creates a line when graphed in the x y -plane. Linear relationships are very common in everyday life. Example: Maya and Geoff's heights. Maya is 3 inches taller than Geoff. linear relationship y x. Maya's height = Geoff's height + 3 y = x + 3. Example: Tai's runs.
Problem 1. Two linear equations are shown below. Complete the table of values for each one and graph the lines in the same coordinate plane. Then answer the questions that follow. a. y = 2 x is a proportional relationship represented by a line through the origin (0, 0). In y = 2 x + 3, what impact does the "+3" have on the table of values ...
What is a linear graph? A linear graph is a straight line graph that shows a relationship between the x -coordinate and the y -coordinate.Some linear graphs show a proportional relationship between the x -coordinate and the y -coordinate.. For example, Take a look at this linear graph. Notice how it passes through the origin, (0, 0). Now, let's write the ratio of each of the points in the ...
Here is a simple example of a word problem where graph helps. From a point #A# on a road at time #t=0# one car started a movement with a speed #s=U# measured in some units of length per unit of time (say, meters per second).. Later on, at time #t=T# (using the same time units as before, like seconds) another car started moving in the same direction along the same road with a speed #s=V ...
I made this video to help my students on this skills practice in Khan Academy. I go through 4 problems and explain how the problems can be solved. It is mean...
Example 6.2.21. For the function f(x) = 2x2 + 4x − 3, evaluate the function. In the last example, we found f(x) for a constant value of x. In the next example, we are asked to find g(x) with values of x that are variables. We still follow the same procedure and substitute the variables in for the x.
Example: y = x 2 - 4x + 3. Exponential Functions: Represented by the equation y = ab x , where a≠0 and b>0, b≠1. The graph of an exponential function has a curved shape that increases or decreases rapidly. The most commonly used exponential function base is the transcendental number e, approximately equal to 2.71828.
Explore math with our beautiful, free online graphing calculator. Graph functions, plot points, visualize algebraic equations, add sliders, animate graphs, and more.
Learn for free about math, art, computer programming, economics, physics, chemistry, biology, medicine, finance, history, and more. ... Graphing linear relationships word problems. Math > Algebra 1 > Linear equations & graphs ... The vertical axis is from zero to four hundred with a scale of forty and is titled Water in liters. The graph of the ...
For problems 1 - 3 construct a table of at least 4 ordered pairs of points on the graph of the equation and use the ordered pairs from the table to sketch the graph of the equation. y = 3x +4 y = 3 x + 4 Solution. y = 1 −x2 y = 1 − x 2 Solution. y = 2 +√x y = 2 + x Solution. For problems 4 - 9 determine the x-intercepts and y ...
Practice and Problem Solving: C 1. a. b. The slope, −0.04, means that each mile driven uses 0.04 gallons of gas. The y-intercept, 12, is the number of gallons of gas in the car. c. 4 2. a. b. The slope, 100, means that each month you deposit $100. The y-intercept, 250, is the amount of money you initially deposited in your account. c. $950 3 ...
Let's explore different ways to find and visualize slopes and intercepts, and how these concepts can help us solve real-world problems. ... Graphing linear relationships word problems Get 3 of 4 questions to level up! Modeling with linear equations and inequalities. Learn. Comparing linear rates example
Practice. Have students practice graphing proportional relationships, interpreting graphs, and constructing equations using the maze activity (page 3), and color by number activity (page 4). Students will also be asked to solve for constant of proportionality in the practice. Walk around to answer student questions.
158 Chapter 4 Graphing and Writing Linear Equations EXAMPLE 3 Modeling Real Life Self-Assessment for Problem Solving Solve each exercise. Th en rate your understanding of the success criteria in your journal. 7. Th e amount y (in liters) of water that fl ows over a natural waterfall in x seconds is represented by the equation y = 500x.Th e graph shows
The interactive, conversational, analytical, and generative features of GenAI offer support for creativity, problem-solving, and processing and digestion of large bodies of information. Therefore ...
Graphing Linear Nonproportional Relationships Using Slope and y-Intercept Practice and Problem Solving: A/B Graph each equation using the slope and the y-intercept. 1. y = 2x −1 2. y = 1 2 ... on a math quiz, where x is the number of questions you answered correctly. a. Graph the equation.
To efficiently address this problem, we explore the relationship among MOQC, its single-objective counterpart problems, and a biobjective optimization problem, along with several properties of the MOQC problem and quasi-cliques. ... makes the Three-phase strategy an effective approach for solving the MOQC problem in terms of running time and ...
Math Teachers ~ You'll LOVE this Graphing Proportional Relationships ~ Tables and Graphs, 2-page-worksheet with Answer Key. It will be your go-to every year when teaching this math skill. Students read the problem, complete the table, record their coordinates, and graph their answer. This helps students to understand the proportional ...
Explore math with our beautiful, free online graphing calculator. Graph functions, plot points, visualize algebraic equations, add sliders, animate graphs, and more.