VENN DIAGRAM REASONING TRICKS
Syllogism is a ‘Greek’ word that means inference or deduction. As such inferences are based on logic, then these inferences are called logical deduction. These deductions are based on propositions (premise).
Different types of questions covered in this section are as follows :
- Two Statements and Two Conclusions
‘Syllogism’ checks basic aptitude and ability of a student to derive inferences from given statements using Venn diagrams and reasoning r solving problems.
Four types of statements :
(i) All A is B
(ii) Some A is B
(iii) Some A is not B
(iv) No A is B

Conclusions :

Some A is B

Some A is not B

Directions : Each of the following questions contains two statements followed by two conclusions numbered I and II. You have to consider the two statements to be true, even if they seen to be at variance at the commonly known facts. You have to decide which of the given conclusions definitely follows from the given statements.
Give answer (a) if only I follows; (b) if only II follows; (c) if either I or II follows; (d) if neither I nor II follows and (e) if both I and II follow.
Question 1 :
Statements :
Some chairs are glasses
All trees are chairs
I. Some trees are glasses
II. Some glasses are trees
Some chairs are glasses :

All trees are chairs :

From the above diagrams, the answer is
(d) neither I nor II follows
Question 2 :
No man is a lion
Ram is a man
I. Ram is not a lion
II. All men are not Ram
No man is a lion :

Ram is a man :

(a) only I follows
Question 3 :
All boys are Fathers
All Fathers are Mothers
I. All Fathers are boys
II. All boys are Mothers
All boys are Fathers :

All Fathers are Mothers :

(b) only II follows
Question 4 :
All pens are cups
All cups are bowls
I. All pens are bowls
II. All cups are pots
All pens are cups :

All cups are bowls :

From the above diagram, it is clear that "A ll pens are bowls". So the first conclusion is true.
In the second conclusion we find the object "Pots". But, the object "Pots" is not a part of either of the two given statements. So, we don't have enough information to decide about the second conclusion.
Therefore, the answer is
Question 5 :
All students are boys
No boy is dull
I. There are no girls in the class
II. No student is dull
All students are boys :

No boy is dull :

From the above two diagrams, it is clear that "No boy is dull". So, the first conclusion is true.
From the first statement " All students are boys", it is clear that " There are no girls in the class". So, the second conclusion is also true.
(e) both I and II follow
Kindly mail your feedback to [email protected]
We always appreciate your feedback.
© All rights reserved. onlinemath4all.com
- Sat Math Practice
- SAT Math Worksheets
- PEMDAS Rule
- BODMAS rule
- GEMDAS Order of Operations
- Math Calculators
- Transformations of Functions
- Order of rotational symmetry
- Lines of symmetry
- Compound Angles
- Quantitative Aptitude Tricks
- Trigonometric ratio table
- Word Problems
- Times Table Shortcuts
- 10th CBSE solution
- PSAT Math Preparation
- Privacy Policy
- Laws of Exponents
Recent Articles
Division by Zero
Mar 30, 24 08:11 AM
Division by Infinity
Mar 29, 24 11:52 AM
Problems on Finding Derivative of a Function
Mar 29, 24 12:11 AM
Practice venn diagrams
This practice package will help you prepare for venn diagrams. All exercises are based on the questions that are used in the assessments of major assessment companies.
Venn Diagrams Free Practice Test
We recommend that you first take a test where you will see the explanation after answering each question or at the end of the test. This way you can first see what kinds of questions occur and how to solve them.
Assessment Practice pack
Parts of the venn diagrams practice pack, venn diagrams explanation.
There are different types of patterns that are often used for venn diagrams. By studying the explanations and example exercises of the different patterns, you will recognise the patterns more easily, work faster and make fewer mistakes.
Venn Diagrams assessments
We recommend doing at least 3 exercise sets with time pressure. At the end of each exercise set, we indicate how your score relates to the norm group and whether you need to work faster or more accurately to get the highest possible score on your assessment. This way you know exactly when you are optimally prepared.
Venn Diagrams Evaluation of your results
Evaluate your results to see if you are optimally prepared for your assessment. By clicking the individual results, you will get a more detailed report of your results with personal advice.
- --> Try Free Downloads
- Computer Science & Applications
- General Paper 1
- Human Resource Management
- Library And Information Science
- Political Science
- Biotechnology (BT)
- Biological Sciences (BL)
- Mathematical Statistics (MS)
- Mathematics (MA)
- Physics (PH)
- Geology (GG)
- Chemistry (CY)
- Economics (EN)
- Chemical Sciences
- Earth Sciences
- Life Sciences
- Mathematical Sciences
- Physical Sciences
- General Aptitude
- JEE Advanced
- Computer Science And IT
- Electronics And Communication
- RRB Group D
- SSC GD Constable
- Choose Exam Goal
- About Eduncle
- Announcements

Speak With a Friendly Mentor.
- My Wishlist
- Subscribe Exams
- Try Free Downloads

Government Jobs
- Articles (53)
- Products (0)
- Reviews

Eduncle posted an Article
How to solve venn diagram question – get methods to solve quickly.

Venn diagrams are one of the easiest topics. By attempting the Venn Diagram questions, you can secure good marks in the competitive exams like RRB, IBPS, SSC exam.
But most of the aspirants stuck in the Venn diagram problems because of the question complexity.
Here in this article, you will get the tricks to solve the venn diagram problems. We have catered some of the venn diagram examples to make to understand the basic concept.
Keep Reading!
What are Venn diagrams?
Any simple closed figure used to represent sets are call Venn diagrams. Venn diagrams use the overlapping circle to show how things are alike and different from each other. It is a graphical comparison of the things by highlighting it.
They are extensively used to teach set theory and commonly known as set diagrams and logic diagrams.
History of Venn Diagram
John Venn is the inventor of the Venn diagram. In 1891, he constructed the Venn diagram to illustrate the inclusive and exclusive relationship between the things. He used them as a comparison tool.
Venn diagram is the illustrations of circles that despite commonalities or differences two sets. Sets are a grouping or collection of items.
Purpose and Benefit
Venn diagrams are used in the diversified field, to compare the items of the universe. By using circular diagram it becomes easy to understand the venn diagram problems.
Here we have shared some benefits that you can get through Venn Diagrams.
Help to Contrast Two or More Choices
Venn diagram helps the student to have a comparison between two or more items. While comparing it becomes quite clear what are the commonalities and differences. This way you can also find out the way for selecting any one among all.
To Solve Complex Mathematical Problems
Using Venn Diagrams can be the best way to solve the complex mathematical problems easily. Once you practice well on Venn Diagram, it can help to resolve the problems related to exclusive relations between different things.
Helpful in Making Strategies
Venn diagram helps you out in making strategies for business, learning, in making statistical data, company hiring the right candidate with all required skills, and in other ways.
Visualization of Concept
Venn diagram is an important strategy which helps the students by visualizing the concepts and compare the idea through the graphical presentation of circles used in Venn diagram.
Colourful Presentation
Venn diagrams are usually represented with the colourful circles, which helps the student to learn and understand the concepts easily.
How to Solve Venn Diagram Questions in Exam – Check the Tips Below!
In competitive exams, you can see different types of Venn Diagram Problems. A candidate must be aware of all type of questions asked in the exams.
Below we have shared some most common types of Venn Diagram. You can clear all the concepts with perfect Venn Diagram Examples through this blog.
When all the items in the question, belong from the different group then you can solve the question by drawing the Venn diagram, will be like:

Do You Want Better RANK in Your Exam?
Start Your Preparations with Eduncle’s FREE Study Material
- Updated Syllabus, Paper Pattern & Full Exam Details
- Sample Theory of Most Important Topic
- Model Test Paper with Detailed Solutions
- Last 5 Years Question Papers & Answers
Sign Up to Download FREE Study Material Worth Rs. 500/-
I agree to the Terms and Conditions
I agree to receive exam notifications via WhatsApp.
Wait Wait Wait... !
We Have Something Special for YOU
Download FREE Study Material Designed by Subject Experts & Qualifiers
Want Enhanced Learning Experience For Exam Preparation?
- Ask Your Doubts and Get Them Answered by Exam Experts & Students' Community Members Across India
- Regular Guidance, Mentorship & Study Tips by Eduncle Experts
- Quality Content with More Than 300 Courses in Multiple Exams Curated by Experts
Enter your mobile number to get the download link.
Learning & Teaching App

Skyrocket Your Chances to RANK HIGHER in the Exam
Time management is very much important in IIT JAM. The eduncle test series for IIT JAM Mathematical Statistics helped me a lot in this portion. I am very thankful to the test series I bought from eduncle.
Eduncle served as my guiding light. It has a responsive doubt solving team which solves & provides good solutions for your queries within 24 hours. Eduncle Mentorship Services guides you step by step regarding your syllabus, books to be used to study a subject, weightage, important stuff, etc.
The General Aptitude part of Eduncle study materials were very good and helpful. Chapters of the Earth Science were also very satisfactory.
The study material of Eduncle helps me a lot. The unit wise questions and test series were helpful. It helped me to clear my doubts. When I could not understand a topic, the faculty support too was good. Thanks Eduncle.
I recommend Eduncle study material & services are best to crack UGC-NET exam because the material is developed by subject experts. Eduncle material consists a good no. of ques with online test series & mock test papers.
I am truly Statisfied with study material of Eduncle.com for English their practise test paper was really awsome because it helped me to crack GSET before NET. Thanks Team of eduncle.
Request a Call back
Let Our Mentors Help You With the Best Guidance

We have Received Your Query
Are you sure you want to Unfollow ?
How can we assist you?

Oops! You Can’t Unfollow Your Default Category.

Your profile has been successfully submitted
Kindly give us 1 - 3 week to review your profile. In case of any query, write to us at [email protected]
Venn Diagram Questions
Venn diagram questions with solutions are given here for students to practice various questions based on Venn diagrams. These questions are beneficial for both school examinations and competitive exams. Practising these questions will develop a skill to solve any problem on Venn diagrams quickly.
Venn diagrams were first introduced by John Venn to represent various propositions in a diagrammatic way. Venn diagrams are used for representing relationships between given sets. For example, natural numbers and whole numbers are subsets of integers represented by the Venn diagram:
Using Venn diagrams, we can easily understand whether given sets are subsets of each other or disjoint sets or have something in common.
- Intersection of Sets
- Union of Sets
- Complement of Set
- Set Operations
Following are some set operations and their meaning useful while solving problems on the Venn diagram:
Some important formulae:
Venn Diagram Questions with Solution
Let us practice some questions based on Venn diagrams.
Question 1: If A and B are two sets such that number of elements in A is 24, number of elements in B is 22 and number of elements in both A and B is 8, find:
(i) n(A ∪ B)
(ii) n(A – B)
(ii) n(B – A)
Given, n(A) = 24, n(B) = 22 and n(A ∩ B) = 8
The Venn diagram for the given information is:
(i) n(A ∪ B) = n(A) + n(B) – n(A ∩ B) = 24 + 22 – 8 = 38.
(ii) n(A – B) = n(A) – n(A ∩ B) = 24 – 8 = 16.
(iii) n(B – A) = n(B) – n(A ∩ B) = 22 – 8 = 14.
Question 2: According to the survey made among 200 students, 140 students like cold drinks, 120 students like milkshakes and 80 like both. How many students like atleast one of the drinks?
Number of students like cold drinks = n(A) = 140
Number of students like milkshake = n(B) = 120
Number of students like both = n(A ∩ B) = 80
Number of students like atleast one of the drinks = n(A ∪ B) = n(A) + n(B) – n(A ∩ B)
= 140 + 120 – 80
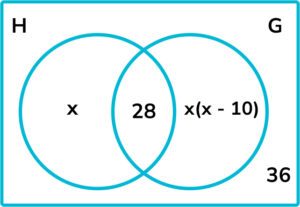
Question 3: In a group of 500 people, 350 people can speak English, and 400 people can speak Hindi. Find how many people can speak both languages?
Let H be the set of people who can speak Hindi and E be the set of people who can speak English. Then,
n(H ∪ E) = 500
We have to find n(H ∩ E).
Now, n(H ∪ E) = n(H) + n(E) – n(H ∩ E)
⇒ 500 = 400 + 350 – n(H ∩ E)
⇒ n(H ∩ E) = 750 – 500 = 250.
∴ 250 people can speak both languages.
Questions 4: The following Venn diagram shows games played by the number of students in a class:
How many students like only cricket and only football?
As per the given Venn diagram,
Number of students only like cricket = 7
Number of students only like football = 14
∴ Number of students like only cricket and only football = 7 + 14 = 21.
Question 5: In a class of 40 students, 20 have chosen Mathematics, 15 have chosen mathematics but not biology. If every student has chosen either mathematics or biology or both, find the number of students who chose both mathematics and biology and the number of students chose biology but not mathematics.
Let, M ≡ Set of students who chose mathematics
B ≡ Set of students who chose biology
n(M ∪ B) = 40
n(B) = n(M ∪ B) – n(M)
⇒ n(B) = 40 – 20 = 20
n(M – B) = 15
n(M) = n(M – B) + n(M ∩ B)
⇒ 20 = 15 + n(M ∩ B)
⇒ n(M ∩ B) = 20 – 15 = 5
n(B – M) = n(B) – n(M ∩ B)
⇒ n(B – M) = 20 – 5 = 15
Question 6: Represent The following as Venn diagram:
(i) A’ ∩ (B ∪ C)
(ii) A’ ∩ (C – B)
Question 7: In a survey among 140 students, 60 likes to play videogames, 70 likes to play indoor games, 75 likes to play outdoor games, 30 play indoor and outdoor games, 18 like to play video games and outdoor games, 42 play video games and indoor games and 8 likes to play all types of games. Use the Venn diagram to find
(i) students who play only outdoor games
(ii) students who play video games and indoor games, but not outdoor games.
Let V ≡ Play video games
I ≡ Play indoor games
O ≡ Play outdoor games
n(V) = 60, n(I) = 70, n(O) = 75
n(I ∩ O) = 30, n(V ∩ O) = 18, n(V ∩ I) = 42
n(V ∩ I ∩ O) = 8
Hence, by Venn diagram
Number of students only like to play only outdoor games = 35
Number of students like to play video games and indoor games but not outdoor games = 34
Note : Always begin to fill the Venn diagram from the innermost part.
Question 8: Using the Venn diagrams, verify (P ∩ Q) ∪ R = (P ∪ R) ∩ (Q ∪ R).
The shaded portion represents (P ∩ Q) ∪ R in the Venn diagram.
Comparing both the shaded portion in both the Venn diagram, we get (P ∩ Q) ∪ R = (P ∪ R) ∩ (Q ∪ R).
Question 9: Prove using the Venn diagram: (B – A) ∪ (A ∩ B) = B.
From the Venn diagram, it is clear that (B – A) ∪ (A ∩ B) = B
Question 10: In a survey, it is found that 21 people read English newspaper, 26 people read Hindi newspaper, and 29 people read regional language newspaper. If 14 people read both English and Hindi newspapers; 15 people read both Hindi and regional language newspapers; 12 people read both English and regional language newspaper and 8 read all types of newspapers, find:
(i) How many people were surveyed?
(ii) How many people read only regional language newspapers?
Let A ≡ People who read English newspapers.
B ≡ People who read Hindi newspapers.
C ≡ People who read Hindi newspapers.
n(A) = 21, n(B) = 26, n(C) = 29
n(A ∩ B) = 14, n(B ∩ C) = 15, n(A ∩ C) = 12
n(A ∩ B ∩ C) = 8
(i) Number of people surveyed = n(A ∪ B ∪ C) = n(A) + n(B) + n(C) – n(A ∩ B) – n(B ∩ C) – n(A ∩ C) + n(A ∩ B ∩ C) = 21 + 26 + 29 – 14 – 15 – 12 + 8 = 43
(ii) By the Venn diagram, number of people who only read regional language newspapers = 10.
Video Lesson on Introduction to Sets

Practice Questions on Venn Diagrams
1. Verify using the Venn diagram:
(i) A – B = A ∩ B C
(ii) (A ∩ B) C = A C ∪ B C
2. For given two sets P and Q, n(P – Q) = 24, n(Q – P) = 19 and n(P ∩ Q) = 11, find:
(iii) n (P ∪ Q)
3. In a group of 65 people, 40 like tea and 10 like both tea and coffee. Find
(i) how many like coffee only and not tea?
(ii) how many like coffee?
4. In a sports tournament, 38 medals were awarded for 500 m sprint, 15 medals were awarded for Javelin throw, and 20 medals were awarded for a long jump. If these medals were awarded to 58 participants and among them only three medals in all three sports, how many received exactly two medals?
Keep visiting BYJU’S to get more such Maths lessons in a simple, concise and easy to understand way. Also, register at BYJU’S – The Learning App to get complete assistance for Maths preparation with video lessons, notes, tips and other study materials.
- Share Share
Register with BYJU'S & Download Free PDFs
Register with byju's & watch live videos.

Teaching support from the UK’s largest provider of in-school maths tuition.

resources downloaded

one to one lessons

schools supported
Teacher-Trusted Tutoring
Personalised one to one tutoring that boosts confidence and doubles progress
FREE secondary maths resources
Here you can find all of our free secondary resources; explore the collections or navigate to each section to filter resources by topic

15 Venn Diagram Questions And Practice Problems (KS3 & KS4): Harder GCSE Exam Style Questions Included
Beki christian.
Venn diagram questions involve visual representations of the relationship between two or more different groups of things. Venn diagrams are first covered in KS1 or KS2 and their complexity and uses progress through KS3 and KS4.
This blog will look at the types of Venn diagram questions that might be encountered at KS3 and KS4, with a focus on exam style example questions and preparing for GCSEs. We will cover problem-solving questions and questions similar to those found on past papers. Each question is followed by a worked solution.
How to solve Venn diagram questions
Venn diagram questions year 7, venn diagram questions year 8, venn diagram questions year 9, foundation gcse venn diagram questions: grades 1-5, higher gcse venn diagram questions: grades 4-9, looking for more venn diagram questions and resources, looking for more ks3 and ks4 maths questions.
Free GCSE maths revision resources for schools As part of the Third Space Learning offer to schools, the personalised online GCSE maths tuition can be supplemented by hundreds of free GCSE maths revision resources from the secondary maths resources library including: – GCSE maths past papers – GCSE maths worksheets – GCSE maths questions – GCSE maths topic list
In KS3, sets and set notation are introduced when working with Venn diagrams. A set is a collection of objects. We identify a set using curly brackets. For example, if set \mathrm{A} contains the odd numbers between 1 and 10 , then we can write this as: A = \{1, 3, 5, 7, 9\}.
Venn diagrams sort objects, called elements, into two or more sets.

This diagram shows the set of elements \{1, 2, 3, 4, 5, 6, 7, 8, 9, 10\} sorted into the following sets.
Set \mathrm{A} = factors of 10
Set \mathrm{B} = even numbers
The numbers in the overlap (intersection) belong to both sets. Those that are not in set \mathrm{A} or set \mathrm{B} are shown outside of the circles.
Different sections of a Venn diagram are denoted in different ways.
\xi represents the whole set, called the universal set.
\emptyset represents the empty set, a set containing no elements.
Let’s check out some other set notation examples!
In KS3 and KS4, we often use Venn diagrams to establish probabilities. We do this by reading information from the Venn diagram and applying the following formula.
For Venn diagrams we can say
15 Venn Diagram Questions & Practice Problems (KS3 & KS4) Worksheet
Download this free worksheet on Venn diagrams. This set of 15 Venn diagram questions and answer key will help you prepare for GCSE maths!
KS3 Venn diagram questions
In KS3, students learn to use set notation with Venn diagrams and start to find probabilities using Venn diagrams. The questions below are examples of questions that students may encounter in Years 7, Year 8 and Year 9.

1. This Venn diagram shows information about the number of people who have brown hair and the number of people who wear glasses.

How many people have brown hair and glasses?

The intersection, where the Venn diagrams overlap, is the part of the Venn diagram which represents brown hair AND glasses. There are 4 people in the intersection.
2. Which set of objects is represented by the Venn diagram below?

We can see from the Venn diagram that there are two green triangles, one triangle that is not green, three green shapes that are not triangles and two shapes that are not green or triangles. These shapes belong to set D.
3. Max asks 40 people whether they own a cat or a dog. 17 people own a dog, 14 people own a cat and 7 people own a cat and a dog. Choose the correct representation of this information on a Venn diagram.

There are 7 people who own a cat and a dog. Therefore, there must be 7 more people who own a cat, to make a total of 14 who own a cat, and 10 more people who own a dog, to make a total of 17 who own a dog.
Once we put this information on the Venn diagram, we can see that there are 7+7+10=24 people who own a cat, a dog or both.
40-24=16 , so there are 16 people who own neither.
4. The following Venn diagrams each show two sets, set \mathrm{A} and set \mathrm{B} . On which Venn diagram has \mathrm{A}^{\prime} been shaded?

\mathrm{A}^{\prime} means not in \mathrm{A} . This is shown in diagram \mathrm{B.}
5. Place these values onto the following Venn diagram and use your diagram to find the number of elements in the set \text{S} \cup \text{O}.
\xi = \{1, 2, 3, 4, 5, 6, 7, 8, 9, 10\} \text{S} = square numbers \text{O} = odd numbers

\text{S} \cup \text{O} is the union of \text{S} or \text{O} , so it includes any element in \text{S} , \text{O} or both. The total number of elements in \text{S} , \text{O} or both is 6.
6. The Venn diagram below shows a set of numbers that have been sorted into prime numbers and even numbers.

A number is chosen at random. Find the probability that the number is prime and not even.
The section of the Venn diagram representing prime and not even is shown below.

There are 3 numbers in the relevant section out of a possible 10 numbers altogether. The probability, as a fraction, is \frac{3}{10}.
7. Some people visit the theatre. The Venn diagram shows the number of people who bought ice cream and drinks in the interval.

Ice cream is sold for £3 and drinks are sold for £2. A total of £262 is spent. How many people bought both a drink and an ice cream?
Money spent on drinks: 32 \times £2 = £64
Money spent on ice cream: 16 \times £3 = £48
£64+£4=£112 , so the information already on the Venn diagram represents £112 worth of sales.
£262-£112 = £150 , so another £150 has been spent.
If someone bought a drink and an ice cream, they would have spent £2+£3 = £5.
£150 \div £5=30 , so 30 people bought a drink and an ice cream.
KS4 Venn diagram questions
At KS4, students are expected to be able to take information from word problems and put it onto a Venn diagram involving two or three sets. The use of set notation is extended and the probabilities become more complex. In the higher tier, Venn diagrams are used to calculate conditional probability.
Venn diagrams appear on exam papers across all exam boards, including Edexcel, AQA and OCR. Questions, particularly in the higher tier, may involve other areas of maths, such as percentages, ratio or algebra.
8. 50 people are asked whether they have been to France or Spain.
18 people have been to France. 23 people have been to Spain. 6 people have been to both.
By representing this information on a Venn diagram, find the probability that a person chosen at random has not been to Spain or France.

6 people have been to both France and Spain. This means 17 more have been to Spain to make 23 altogether, and 12 more have been to France to make 18 altogether. This makes 35 who have been to France, Spain or both and therefore 15 who have been to neither.
The probability that a person chosen at random has not been to France or Spain is \frac{15}{50}.
9. Some people were asked whether they like running, cycling or swimming. The results are shown in the Venn diagram below.

One person is chosen at random. What is the probability that the person likes running and cycling?

9 people like running and cycling (we include those who also like swimming) out of 80 people altogether. The probability that a person chosen at random likes running and cycling is \frac{9}{80}.
10. ξ = \{1, 2, 3, 4, 5, 6, 7, 8, 9, 10, 11, 12, 13, 14, 15, 16\}
\text{A} = \{ even numbers \}
\text{B} = \{ multiples of 3 \}
By completing the following Venn diagram, find \text{P}(\text{A} \cup \text{B}^{\prime}).

\text{A} \cup \text{B}^{\prime} means \text{A} or not \text{B} . We need to include everything that is in \text{A} or is not in \text{B} . There are 13 elements in \text{A} or not in \text{B} out of a total of 16 elements.
Therefore \text{P}(\text{A} \cup \text{B}^{\prime}) = \frac{13}{16}.
11. ξ = \{1, 2, 3, 4, 5, 6, 7, 8, 9, 10, 11, 12\}
A = \{ multiples of 2 \}
By putting this information onto the following Venn diagram, list all the elements of B.

We can start by placing the elements in \text{A} \cap \text{B} , which is the intersection.

We can then add any other multiples of 2 to set \text{A}.

Next, we can add any unused elements from \text{A} \cup \text{B} to \text{B}.

Finally, any other elements can be added to the outside of the Venn diagram.

The elements of \text{B} are \{1, 2, 3, 4, 6, 12\}.
12. Some people were asked whether they like strawberry ice cream or chocolate ice cream. 82\% said they like strawberry ice cream and 70\% said they like chocolate ice cream. 4\% said they like neither.
By putting this information onto a Venn diagram, find the percentage of people who like both strawberry and chocolate ice cream.

Here, the percentages add up to 156\%. This is 56\% too much. In this total, those who like chocolate and strawberry have been counted twice and so 56\% is equal to the number who like both chocolate and strawberry. We can place 56\% in the intersection, \text{C} \cap \text{S}
We know that the total percentage who like chocolate is 70\%, so 70-56 = 14\%-14\% like just chocolate. Similarly, 82\% like strawberry, so 82-56 = 26\%-26\% like just strawberry.

13. The Venn diagram below shows some information about the height and gender of 40 students.

A student is chosen at random. Find the probability that the student is female given that they are over 1.2m.
We are told the student is over 1.2m. There are 20 students who are over 1.2m and 9 of them are female. Therefore the probability that the student is female given they are over 1.2m is \frac{9}{20}.

14. The Venn diagram below shows information about the number of students who study history and geography.
H = history
G = geography
Work out the probability that a student chosen at random studies only history.
We are told that there are 100 students in total. Therefore:
x = 12 or x = -3 (not valid) If x = 12, then the number of students who study only history is 12, and the number who study only geography is 24. The probability that a student chosen at random studies only history is \frac{12}{100}.
15. 50 people were asked whether they like camping, holiday home or hotel holidays.
18\% of people said they like all three. 7 like camping and holiday homes but not hotels. 11 like camping and hotels. \frac{13}{25} like camping.
Of the 27 who like holiday homes, all but 1 like at least one other type of holiday. 7 people do not like any of these types of holiday.
By representing this information on a Venn diagram, find the probability that a person chosen at random likes hotels given that they like holiday homes.

Put this information onto a Venn diagram.

We are told that the person likes holiday homes. There are 27 people who like holiday homes. 19 of these also like hotels. Therefore, the probability that the person likes hotels given that they like holiday homes is \frac{19}{27}.
Third Space Learning’s free GCSE maths resource library contains detailed revision lessons with step-by-step instructions on how to solve Venn diagram problems, as well as worksheets with Venn diagram practice questions and more GCSE exam questions.
Take a look at the Venn diagram lessons today – more are added every week.
- 15 Probability Questions
- 15 Ratio Questions
- 15 Trigonometry Questions
- 15 Algebra Questions
- 15 Simultaneous equations questions
- 15 Pythagoras theorem questions
- Long Division Questions
- Ratio Table Questions
Do you have students who need extra support in maths? Every week Third Space Learning’s maths specialist tutors support thousands of students across hundreds of schools with weekly online 1-to-1 lessons and maths interventions designed to address learning gaps and boost progress. Since 2013 we’ve helped over 162,000 primary and secondary students become more confident, able mathematicians. Learn more or request a personalised quote for your school to speak to us about your school’s needs and how we can help.
Secondary school tuition designed to plug gaps and prepare KS3 and KS4 students for the challenges ahead.
Related Articles

FREE Essential GCSE Worksheet Pack
Help your students prepare for their maths GCSE with this free pack of our most frequently downloaded worksheets.
Contains skills-based, applied and exam style questions that are suitable for foundation and higher GCSE maths revision for AQA, OCR and Edexcel exam boards.
Privacy Overview
Your Free 1-on-1 Career Guidance Call
- Afghanistan +93
- Albania +355
- Algeria +213
- American Samoa +1
- Andorra +376
- Angola +244
- Anguilla +1
- Antigua & Barbuda +1
- Argentina +54
- Armenia +374
- Ascension Island +247
- Australia +61
- Austria +43
- Azerbaijan +994
- Bahrain +973
- Bangladesh +880
- Barbados +1
- Belarus +375
- Belgium +32
- Belize +501
- Bhutan +975
- Bolivia +591
- Bosnia & Herzegovina +387
- Botswana +267
- British Indian Ocean Territory +246
- British Virgin Islands +1
- Brunei +673
- Bulgaria +359
- Burkina Faso +226
- Burundi +257
- Cambodia +855
- Cameroon +237
- Cape Verde +238
- Caribbean Netherlands +599
- Cayman Islands +1
- Central African Republic +236
- Christmas Island +61
- Cocos (Keeling) Islands +61
- Colombia +57
- Comoros +269
- Congo - Brazzaville +242
- Congo - Kinshasa +243
- Cook Islands +682
- Costa Rica +506
- Côte d’Ivoire +225
- Croatia +385
- Curaçao +599
- Cyprus +357
- Czech Republic +420
- Denmark +45
- Djibouti +253
- Dominica +1
- Dominican Republic +1
- Ecuador +593
- El Salvador +503
- Equatorial Guinea +240
- Eritrea +291
- Estonia +372
- Eswatini +268
- Ethiopia +251
- Falkland Islands +500
- Faroe Islands +298
- Finland +358
- French Guiana +594
- French Polynesia +689
- Gambia +220
- Georgia +995
- Germany +49
- Gibraltar +350
- Greenland +299
- Guadeloupe +590
- Guatemala +502
- Guernsey +44
- Guinea +224
- Guinea-Bissau +245
- Guyana +592
- Honduras +504
- Hong Kong +852
- Hungary +36
- Iceland +354
- Indonesia +62
- Ireland +353
- Isle of Man +44
- Israel +972
- Jordan +962
- Kazakhstan +7
- Kiribati +686
- Kosovo +383
- Kuwait +965
- Kyrgyzstan +996
- Latvia +371
- Lebanon +961
- Lesotho +266
- Liberia +231
- Liechtenstein +423
- Lithuania +370
- Luxembourg +352
- Madagascar +261
- Malawi +265
- Malaysia +60
- Maldives +960
- Marshall Islands +692
- Martinique +596
- Mauritania +222
- Mauritius +230
- Mayotte +262
- Micronesia +691
- Moldova +373
- Monaco +377
- Mongolia +976
- Montenegro +382
- Montserrat +1
- Morocco +212
- Mozambique +258
- Myanmar (Burma) +95
- Namibia +264
- Netherlands +31
- New Caledonia +687
- New Zealand +64
- Nicaragua +505
- Nigeria +234
- Norfolk Island +672
- North Korea +850
- North Macedonia +389
- Northern Mariana Islands +1
- Pakistan +92
- Palestine +970
- Panama +507
- Papua New Guinea +675
- Paraguay +595
- Philippines +63
- Portugal +351
- Puerto Rico +1
- Réunion +262
- Romania +40
- Rwanda +250
- San Marino +378
- São Tomé & Príncipe +239
- Saudi Arabia +966
- Senegal +221
- Serbia +381
- Seychelles +248
- Sierra Leone +232
- Singapore +65
- Sint Maarten +1
- Slovakia +421
- Slovenia +386
- Solomon Islands +677
- Somalia +252
- South Africa +27
- South Korea +82
- South Sudan +211
- Sri Lanka +94
- St Barthélemy +590
- St Helena +290
- St Kitts & Nevis +1
- St Lucia +1
- St Martin +590
- St Pierre & Miquelon +508
- St Vincent & Grenadines +1
- Suriname +597
- Svalbard & Jan Mayen +47
- Switzerland +41
- Taiwan +886
- Tajikistan +992
- Tanzania +255
- Thailand +66
- Timor-Leste +670
- Tokelau +690
- Trinidad & Tobago +1
- Tunisia +216
- Turkmenistan +993
- Turks & Caicos Islands +1
- Tuvalu +688
- Uganda +256
- Ukraine +380
- United Arab Emirates +971
- United Kingdom +44
- United States +1
- Uruguay +598
- US Virgin Islands +1
- Uzbekistan +998
- Vanuatu +678
- Vatican City +39
- Venezuela +58
- Vietnam +84
- Wallis & Futuna +681
- Western Sahara +212
- Zambia +260
- Zimbabwe +263
- Åland Islands +358
Thank you for Registering
Verbal Reasoning
Venn Diagrams
Questions & Answers

Venn Diagrams Questions & Answers
Learn how to solve venn diagrams questions effectively with comprehensive solutions. Practice a wide range of venn diagrams questions and answers to enhance your understanding of venn diagrams concepts.
- Seating Arrangement
- Coding and Decoding
- Blood Relation
- Direction Sense
- Cube and Cuboid
- Data Sufficiency
- Logical Sequence of Words
In the given figure, how many plastic balls are there ?

Report a Problem!
In the given figure, how many red objects are not plastic ?
In a college, 200 students are randomly selected. 140 like tea, 120 like coffee and 80 like both tea and coffee. How many students like neither tea , nor coffee ?
In a college, 200 students are randomly selected. 140 like tea, 120 like coffee and 80 like both tea and coffee. How many students only tea ?
Out of 10,000 persons surveyed, 3700 liked Mumbai, 4000 liked Bangalore, and 5000 liked Chennai. Seven hundred people liked Mumbai and Bangalore, 1200 liked Mumbai and Chennai and 1000 liked Bangalore and Chennai. Each person liked atleast one of the three. Find the number of people who liked all the three cities.
Out of 10,000 persons surveyed, 3700 liked Mumbai, 4000 liked Bangalore, and 5000 liked Chennai. Seven hundred people liked Mumbai and Bangalore, 1200 liked Mumbai and Chennai and 1000 liked Bangalore and Chennai. Each person liked atleast one of the three. Find the number of people who like only Bangalore and Chennai ?
Out of 10,000 persons surveyed, 3700 liked Mumbai, 4000 liked Bangalore, and 5000 liked Chennai. Seven hundred people liked Mumbai and Bangalore, 1200 liked Mumbai and Chennai and 1000 liked Bangalore and Chennai. Each person liked atleast one of the three. Find the number of people who like at least two cities ?

Practice Venn Diagrams Questions & Answers
To better their understanding of venn diagrams concepts and enhance their ability to answer questions quickly and accurately, candidates should engage in regular practice of venn diagrams questions.
Importance : Low
Difficulty level: 1 out of 5 (Easy)
Examination: SSC, Banking, GMAT, GRE, SAT, CAT, etc.
Parent section: Verbal Reasoning
Why Choose Us for Practicing Venn Diagram Questions?
The following are the reasons to choose our platform for practicing the venn diagrams questions:
1. One Stop Solution
Our platform is a complete learning hub where students not only practice venn diagrams questions, but also get to understand venn diagrams concepts, tips, and shortcuts. It's an all-in-one solution for mastering the venn diagrams topic.
2. User-friendly Interface
Our interface is designed to provide a smooth learning experience. Along with practicing venn diagrams questions, students can also access explanations for answers, discuss their doubts in forums, and leverage numerous other features that foster effective learning.
3. Curated by Experts
All our venn diagrams resources, including questions and solutions, are curated by industry experts and experienced teachers. These professionals have simplified complex venn diagrams concepts into understandable bytes, enabling students to apply this knowledge effectively.
4. Regularly Updated
We diligently follow the latest patterns of competitive examinations and update our content based on the current syllabus. Hence, our venn diagrams questions are consistently revised and remain relevant.
5. Completely Free
We encourage students to be entirely focused on their venn diagrams topic preparation. Therefore we don't charge any fees, and the entire platform is free to use.
6. Wide Array of Question Categories
We cover all types of venn diagrams questions, ensuring comprehensive preparation for students. Just by practicing on our platform, students can be confident about cracking the verbal reasoning questions in placement exams.
Verbal Reasoning - Venn Diagrams
- Venn Diagrams - Introduction
- Venn Diagrams - Venn Diagram 1
- Venn Diagrams - Venn Diagram 2
- Venn Diagrams - Venn Diagram 3
- Venn Diagrams - Venn Diagram 4
- Venn Diagrams - Venn Diagram 5
- Venn Diagrams - Venn Diagram 6
- Venn Diagrams - Venn Diagram 7
- Venn Diagrams - Venn Diagram 8
- Venn Diagrams - Venn Diagram 9
Introduction:
The main aim of this section is to test your ability about the relation between some items of a group by diagrams. In these questions some figures of circles and some words are given. You have to choose a figure which represents the given words.
Some critical examples are given below:
If all the words are of different groups, then they will be shown by the diagram as given below.
Dog, Cow, Horse

All these three are animals but of different groups, there is no relation between them. Hence they will be represented by three different circles.
If the first word is related to second word and second word is related to third word. Then they will be shown by diagram as given below.
Unit, Tens, Hundreds

Ten units together make one Tens or in one tens, whole unit is available and ten tens together make one hundreds.
If two different items are completly related to third item, they will be shown as below.
Pen, Pencil, Stationery

If there is some relation between two items and these two items are completely related to a third item they will be shown as given below.
Women, Sisters, Mothers

Some sisters may be mothers and vice-versa. Similarly some mothers may not be sisters and vice-versa. But all the sisters and all the mothers belong to women group.
Two items are related to a third item to some extent but not completely and first two items totally different.
Students, Boys, Girls

The boys and girls are different items while some boys may be students. Similarly among girls some may be students.
All the three items are related to one another but to some extent not completely.
Boys, Students, Athletes

Some boys may be students and vice-versa. Similarly some boys may be athletes and vice-versa. Some students may be athletes and vice-versa.
Two items are related to each other completely and third item is entirely different from first two.
Lions, Carnivorous, Cows

All the lions are carnivorous but no cow is lion or carnivorous.
First item is completely related to second and third item is partially related to first and second item.
Dogs, Animals, Flesh-eaters

All the dogs are belonging to animals but some dogs are flesh eater but not all.
First item is partially related to second but third is entirely different from the first two.
Dogs, Flesh-eaters, Cows

Some dogs are flesh-eaters but not all while any dog or any flesh-eater cannot be cow.
Current Affairs
Interview questions, group discussions.
- Data Interpretation
- Verbal Ability
- Verbal Test
- C Programming
- Technical Interview
- Placement Papers
- Submit Paper

- Testimonial
- Web Stories
Learning Home

Not Now! Will rate later

Venn Diagram: Concept and Solved Questions

What is a Venn Diagram?
Venn diagram, also known as Euler-Venn diagram is a simple representation of sets by diagrams. The usual depiction makes use of a rectangle as the universal set and circles for the sets under consideration.
In CAT and other MBA entrance exams, questions asked from this topic involve 2 or 3 variable only. Therefore, in this article we are going to discuss problems related to 2 and 3 variables.
Let's take a look at some basic formulas for Venn diagrams of two and three elements.
n ( A ∪ B) = n(A ) + n ( B ) - n ( A∩ B) n (A ∪ B ∪ C) = n(A ) + n ( B ) + n (C) - n ( A ∩ B) - n ( B ∩ C) - n ( C ∩ A) + n (A ∩ B ∩ C )
And so on, where n( A) = number of elements in set A. Once you understand the concept of Venn diagram with the help of diagrams, you don’t have to memorize these formulas.
Venn Diagram in case of two elements

Where; X = number of elements that belong to set A only Y = number of elements that belong to set B only Z = number of elements that belong to set A and B both (AB) W = number of elements that belong to none of the sets A or B From the above figure, it is clear that n(A) = x + z ; n (B) = y + z ; n(A ∩ B) = z; n ( A ∪ B) = x +y+ z. Total number of elements = x + y + z + w
- CAT Admit Card
- CAT Eligibility Criteria
- CAT Exam Pattern
- CAT Preparation
- CAT Registration
- CAT 2019 Analysis
- CAT Study Material
- CAT 2021 Crash Course
- CAT 2023 Analysis
- B-School Application Form
- CAT Percentile Predictor
- MBA College Counselling
- CAT Notification
- CAT Syllabus
- CAT Question Papers
- CAT Sample Papers
- CAT Mock Test
- CAT Test Series
- CAT Cut Off
- CAT Colleges
- CAT Online Coaching
Venn Diagram in case of three elements

Where, W = number of elements that belong to none of the sets A, B or C
Tip: Always start filling values in the Venn diagram from the innermost value.
Solved Examples
Example 1: In a college, 200 students are randomly selected. 140 like tea, 120 like coffee and 80 like both tea and coffee.
- How many students like only tea?
- How many students like only coffee?
- How many students like neither tea nor coffee?
- How many students like only one of tea or coffee?
- How many students like at least one of the beverages?
Solution: The given information may be represented by the following Venn diagram, where T = tea and C = coffee.

- Number of students who like only tea = 60
- Number of students who like only coffee = 40
- Number of students who like neither tea nor coffee = 20
- Number of students who like only one of tea or coffee = 60 + 40 = 100
- Number of students who like at least one of tea or coffee = n (only Tea) + n (only coffee) + n (both Tea & coffee) = 60 + 40 + 80 = 180
Example 2: In a survey of 500 students of a college, it was found that 49% liked watching football, 53% liked watching hockey and 62% liked watching basketball. Also, 27% liked watching football and hockey both, 29% liked watching basketball and hockey both and 28% liked watching football and basket ball both. 5% liked watching none of these games.
- How many students like watching all the three games?
- Find the ratio of number of students who like watching only football to those who like watching only hockey.
- Find the number of students who like watching only one of the three given games.
- Find the number of students who like watching at least two of the given games.
Solution: n(F) = percentage of students who like watching football = 49% n(H) = percentage of students who like watching hockey = 53% n(B)= percentage of students who like watching basketball = 62% n ( F ∩ H) = 27% ; n (B ∩ H) = 29% ; n(F ∩ B) = 28% Since 5% like watching none of the given games so, n (F ∪ H ∪ B) = 95%. Now applying the basic formula, 95% = 49% + 53% + 62% -27% - 29% - 28% + n (F ∩ H ∩ B) Solving, you get n (F ∩ H ∩ B) = 15%.
Now, make the Venn diagram as per the information given. Note: All values in the Venn diagram are in percentage.

- Number of students who like watching all the three games = 15 % of 500 = 75.
- Ratio of the number of students who like only football to those who like only hockey = (9% of 500)/(12% of 500) = 9/12 = 3:4.
- The number of students who like watching only one of the three given games = (9% + 12% + 20%) of 500 = 205
- The number of students who like watching at least two of the given games=(number of students who like watching only two of the games) +(number of students who like watching all the three games)= (12 + 13 + 14 + 15)% i.e. 54% of 500 = 270.
To know the importance of this topic, check out some previous year CAT questions from this topic:
CAT 2017 Solved Questions:
Solution: It is given that 200 candidates scored above 90th percentile overall in CET. Let the following Venn diagram represent the number of persons who scored above 80 percentile in CET in each of the three sections:

2. From the given condition, g is a multiple of 5. Hence, g = 20. The number of candidates at or above 90th percentile overall and at or above 80th percentile in both P and M = e + g = 60.
3. In this case, g = 20. Number of candidates shortlisted for AET = d + e + f + g = 10 + 40 + 100 + 20 = 170
4. From the given condition, the number of candidates at or above 90th percentile overall and at or above 80th percentile in P in CET = 104. The number of candidates who have to sit for separate test = 296 + 3 = 299.
Another type of questions asked from this topic is based on maxima and minima. We have discussed this type in the other article.
Key Learning:
- It is important to carefully list the conditions given in the question in the form of a Venn diagram.
- While solving such questions, avoid taking many variables.
- Try solving the questions using the Venn diagram approach and not with the help of formulae.
You can also post in the comment section below, any query or explanation for any concept mentioned in the article.
- CAT Logical Reasoning
- CAT Reading Comprehension
- CAT Grammar
- CAT Para Jumbles
- CAT Data Interpretation
- CAT Data Sufficiency
- CAT DI Questions
- CAT Analytical Reasoning
Most Popular Articles - PS

All About the Quantitative Aptitude of CAT

Number System for CAT Made Easy

100 Algebra Questions Every CAT Aspirant Must Solve
Use Creativity to crack CAT

Averages: Finding the Missing Page Number

Strategy for Quant Questions in CAT

Comprehensive Guide for CAT Probability

Comprehensive Guide for CAT Mensuration

Chess Board: How to find Number of Squares and Rectangles
100 Geometry questions every CAT aspirant must solve
Permutation and combination and probability for cat.
Tackle Time, Speed & Distance for CAT

Sequences and Series - Advanced
-thumbnail_0.png?null&itok=Xhd6gz54 "CAT Formulae Book")
CAT Formulae E-Book

Races and Games

Geometry: Shortcuts and Tricks
-thumbnail.png?null&itok=USokav20 "title=")
Number System-Integral Solutions: Shortcuts and Tricks

Permutation and Combination: Advanced

Geometry - Polygons
-thumbnail.png?null&itok=B9Rsz-Xq "title=")
Number System: Integral Solutions and Remainders based on Factorials

How to improve in Geometry & Mensuration

How to improve in Permutation and Combination

Cheat Codes: Permutation and Combination

How to improve in Algebra
Download our app.
- Learn on-the-go
- Unlimited Prep Resources
- Better Learning Experience
- Personalized Guidance
Get More Out of Your Exam Preparation - Try Our App!
Reasoning Questions
Logical venn diagrams aptitude questions.
In these questions, three elements will be given which may or may not have the same link. Based on the relationship between the individual elements, we have to identify the diagram in which these elements would fit into. So, you have to practice a lot of different examples to identify a suitable relationship and the correct diagram.

Once you complete this section, you may move to Direction Sense Test Aptitude Questions .
Related Posts

Data Sufficiency Aptitude Questions
2 years ago

Blood Relations Aptitude Questions

Puzzle Test Aptitude Questions
Popular posts.

Byjus Recruitment Process

Top Wipro HR interview questions for freshers
Requirement for trainee network engineer 2020 & 2021.
SreeTech Inc is looking for fresh graduates for th...
Login to proceed further...
Attend placement drives with us.
Enrol for fullstack java with pay after placement
We would love to hear from you!
Holi Offer - Use Code HOLI24
Register Now
- About us |
- Our results
- +91-9067201000

- Current Affairs
- RBI Grade B
- RBI Assistant
- NABARD Grade A
- NABARD Assistant
- SEBI Grade A
- SEBI Grade A Legal
- SBI SO Marketing
- Scale ii GBO
- Scale ii Marketing
- Scale ii Law
- Scale III Officer
- IBPS SO Marketing
- IBPS SO Law
- IBPS SO AFO
- NISM Mutual Funds
- NISM Equity Derivatives
- Scale II (Credit)
- Scale III(Credit)
- Management Trainee
- Credit Officer (Scale II)
- Financial Analyst (Scale III)
- Human Resources
- Lending Operations
- Investment & Treasury
- Risk Management
- General Administration
- Credit Officer Scale II
- Human Resources Scale II
- Senior HR Scale III
- Law scale II
- Senior Law Scale III
- Marketing Scale II
- Treasury Scale II
- Senior Manager(MSME)
- General Knowledge
- Banking Awareness
- Financial Awareness
- Quantitative Aptitude
- Reasoning Ability
- English Language
- Interview Preparation
- Computer Awareness
- Descriptive English
- Professional Knowledge(IT)
- Bank Promotion Exams
- Computer Awareness Quiz
- Reading Comprehensions
- Data Interpretation
- Banking Awareness Quiz
- Upcoming Bank Exams
- Credit officer Notifications
- IBPS Calendar 2024-25
- Previous Papers
- Monthly GK Digest
- PIB Monthly Summary
- Study Notes
- Vocabulary Bites
Venn Diagram Questions and Shortcuts
- > https://www.bankexamstoday.com/2014/06/venn-diagram-questions-and-shortcuts.html' rel='noreferrer' target='_blank'> Whatsapp

Must read
- Important Probability-Venn Diagram questions
- Quantitative Aptitude Preparation series

Ramandeep Singh is a seasoned educator and banking exam expert at BankExamsToday. With a passion for simplifying complex concepts, he has been instrumental in helping numerous aspirants achieve their banking career goals. His expertise and dedication make him a trusted guide in the journey to banking success.
Aptitude Quiz on Venn Diagrams
Aptitude questions on venn diagrams. these questions are meant for those who are preparing for exams that test a candidate's mental ability..
This is a collection of logical reasoning questions on Venn diagrams. These can be very useful for you if you are preparing for any exam that requires you to have mental ability and reasoning skills.
Recently Added and Reviewed
We are constantly adding new content and reviewing older posts so that we can provide live information, updated with new facts and interesting things related to them. These are the most recently added and reviewed posts. Click on them to go through them.
Discussion of Questions on Venn Diagrams
This page contains specially picked up and originally created questions on venn diagrams. these questions are tough and will be helpful to all those preparing for reasoning paper of the entrance exams. solutions and answers to each of them have been provided. you can even discuss them with others..
Last Reviewed and Updated on February 7, 2020, Category: Venn Diagrams
Using Venn Diagrams to Depict Relationships between Things
Here is an explanation of how to draw venn diagrams for sets of things when they have different relationships with each other. illustrative examples have been given for each and every case. i have explained disjoint sets, i have also explained the sets that intersect, and also the cases where one set is included inside another., importance of some, both, all and none in venn diagrams, these keywords can easily help you draw a venn diagram between sets. you will find this simple trick quite effective in drawing venn diagrams for syllogism questions. the concept has been explained with best examples., aptitude questions on venn diagrams set 1, aptitude questions and quiz on venn diagrams. these are meant for those who are preparing for bank exams, gate exam, ntse and other mental ability exams. this is quiz no. 1 in this series., aptitude questions on venn diagrams set 2, aptitude questions and quiz on venn diagrams. these are meant for those who are preparing for bank exams, gate exam, ntse and other mental ability exams. this is quiz no. 2 in this series., aptitude questions on venn diagrams set 3, aptitude questions and quiz on venn diagrams. these are meant for those who are preparing for bank exams, gate exam, ntse and other mental ability exams. this is quiz no. 3 in this series., aptitude questions on venn diagrams set 4, aptitude questions and quiz on venn diagrams. these are meant for those who are preparing for bank exams, gate exam, ntse and other mental ability exams. this is quiz no. 4 in this series., aptitude questions on venn diagrams set 5, aptitude questions and quiz on venn diagrams. these are meant for those who are preparing for bank exams, gate exam, ntse and other mental ability exams. this is quiz no. 5 in this series., aptitude questions on venn diagrams set 6, aptitude questions and quiz on venn diagrams. these are meant for those who are preparing for bank exams, gate exam, ntse and other mental ability exams. this is quiz no. 6 in this series., aptitude questions on venn diagrams set 7, aptitude questions and quiz on venn diagrams. these are meant for those who are preparing for bank exams, gate exam, ntse and other mental ability exams. this is quiz no. 7 in this series., aptitude questions on venn diagrams set 8, aptitude questions and quiz on venn diagrams. these are meant for those who are preparing for bank exams, gate exam, ntse and other mental ability exams. this is quiz no. 8 in this series..
- All Platforms
- First Naukri
- All Companies
- Cognizant GenC
- Cognizant GenC Next
- Cognizant GenC Elevate
- Goldman Sachs
- Infosys SP and DSE
- TCS CodeVita
- TCS Digital
- TCS iON CCQT
- TCS Smart Hiring
- Tech Mahindra
- Zs Associates
- Top 100 Codes
- Learn Python
- Learn Data Structures
- Learn Competitve & Advanced Coding
- Learn Operating System
- Software Engineering
- Online Compiler
- Microsoft Coding Questions
- Amazon Coding Questions
- Learn Logical
- Learn Verbal
- Learn Data Interp.
- Psychometric Test
- All Syllabus
- Cognizant-Off Campus
- L&T Infotech
- Mahindra ComViva
- Reliance Jio
- Wells Fargo
- ZS-Associates
- Interview Preparation
- HR Interview
- Virtual Interview
- Technical Interview
- Group Discussions
- All Interview Exp.
- Accenture ASE
- ZS Associates
- Get OffCampus updates
- On Instagram
- On LinkedIn
- On Telegram
- On Whatsapp
- AMCAT vs CoCubes vs eLitmus vs TCS iON CCQT
- Companies hiring via TCS iON CCQT
- Companies hiring via CoCubes
- Companies hiring via AMCAT
- Companies hiring via eLitmus
- Companies hiring from AMCAT, CoCubes, eLitmus
- Prime Video
- PrepInsta Prime
- The Job Company
- Placement Stats

Notifications Mark All Read

TCS NQT OffCampus Hiring Announced for 2024 Batch
- Get Prime
- Shortcut, tips, and tricks
- Get Off-campus Drive Updates
- Get Hiring Updates
Tips Tricks And Shortcuts To Solve Syllogism Questions
September 6, 2023
Tips and Tricks to Solve Syllogism Problems

Shortcut, Tips and Tricks of Syllogism to remember
Since Syllogism comprises of some statements, each of which is divided into two parts that are a subject and a predicate.
Subject – a Main matter of discussion. Predicate – the part which states something about the subject.
There are four types of statements, each of which is mentioned below with the help of an example:
Type 1: All P is Q
It can be portrayed with the help of a venn diagram:, from this we can definitely conclude that:.
- All P’s are Q’s
- Some P’s are Q’s
- And some Q’s are P’s
But we cannot be sure that:
- All Q’s are P’s
- Some Q’s are not P’s
Type 2: No P’s are Q’s

From the diagram we can definitely conclude that:
- Some Q’s are P’s
Possible conclusion:
- Some P’s are not Q’s
- Some Q’s are not P’s.

Prime Course Trailer
Related banners.
Get PrepInsta Prime & get Access to all 200+ courses offered by PrepInsta in One Subscription
Also Check Out
Type 3: some p’s are q’s.

Hence from the above diagrams we’ve summarized some quick Tips and Tricks to be memorized, to Solve Syllogism questions:
Definite cases: (For questions containing only two items)
- All+ All= All
- All+ No= No
- All+ Some= No conclusion
- Some+ All= Some
- Some+ No= Some Not
- Some+ Some= No conclusion
Possible cases:
1)If all P’s are Q’s that does not mean that all Q’s are P’s which means that some Q’s cannot be P.
All P’s are Q’s—->Some Q’s are not P’s
2)If some Q’s are not P’s——->There is possibility that all P’s are not Q’s
3)If some P’s are Q’s——->There is possibility that all P’s are Q’s and all Q’s are P’s
Shortcut, Tips and Tricks to Solve Syllogism using various methods:
1.) Verbal Method
Test takers relatively less use the verbal way of explaining syllogism questions. The test taker understands the set of premises and based on the ability to understand the assumptions, verbally derives a conclusion. The method is useful for less complicated questions.
For example
Statement I: Some human is rich. Statement II: All rich are men.
Conclusion:
1. Some human is a man. 2.All men are rich.
- The only Conclusion I follows
- Only Conclusion II follows
- Either conclusion I or Conclusion II follows
- Neither conclusion I nor Conclusion II follows
Explanation:
From the above statements it is clear that some humans are rich and all rich are man, therefore there is a possibility that some some humans are man.
2.) Venn Diagram method
The Venn diagram method allows the test taker to solve the questions diagrammatically. This method is very useful in solving syllogism questions. This is illustrated well with the help of some bullet points mentioned below:
- Firstly we have to draw the diagram based on the given statements.
- Then we have to check which conclusion follow the given information, with the help of the diagram.
- If the Conclusion is fulfilling one condition but is not accomplishing the other conditions represented in the diagram, then it will not be considered as a conclusion.
- Hence the final conclusion should be made only if it follows all the possible conditions.
Statement I: All P’s are Q’s Statement II: All Q’s are R’s Statement III: Some R’s are S
- All P are R
- All S are R
- Neither conclusion I nor Conclusion II follow s
The last diagram is the final one, and based on this we will draw conclusions.
Conclusion 1 is true as Circle representing P is completely inside circle representing R
Conclusion 2 is false as circle representing Q is completely inside circle representing R.
Therefore there is no possibility that no Q are R.
Conclusion 3 is also not true because some part of S is some part of R.
Therefore we can say that only conclusion 1 follows.
Hence option 1 is the correct one.

For Example
Statements : No singers are actors. Some actors are artists. No artist is artisan.
Conclusions : I. Some artists are not singers. II. Some artisans are not actors.
Options 1.Neither conclusion I nor conclusion II follows 2.Only conclusion I follow 3.Only conclusion II follow 4.Both the conclusions follow Explanation : Analyzing Conclusion I : Some artists are not singers. Some artists are actors (reverse of Statement 2) + No actor is singer (reverse of Statement 1) = Some artists are not singers. Clearly, Conclusion 1 follows. Analyzing Conclusion II : Some actors are artists + No artist is artisan = Some actors are not artisans. Since reverse of an Partial Negative statement is not possible, Conclusion 2 doesn’t follow.
Statements : All wells are rivers. All seas are rivers. Some rivers are not seas.
Conclusions : I. Some wells are not seas. II. Some seas may not be rivers.
Options 1.Neither conclusion I nor conclusion II follows 2.Only conclusion I follow 3.Only conclusion II follow 4.Both the conclusions follow
Explanation: Analyzing Conclusion I : Some wells are not seas. Neither Statement 1 nor 2 is a negative statement. So, negative conclusion between the classes of ‘wells’ and ‘seas’ is not possible. Hence, Conclusion 1,doesn’t follow. Analyzing Conclusion II : Some seas may not be rivers. In Statement 3 : ‘Some rivers are not seas’. Here, we are not sure of the elements of the class ‘seas’. So, it means that ‘Some seas may not be rivers’. Conclusion 2, hence, follows.

Get over 200+ course One Subscription
Courses like AI/ML, Cloud Computing, Ethical Hacking, C, C++, Java, Python, DSA (All Languages), Competitive Coding (All Languages), TCS, Infosys, Wipro, Amazon, DBMS, SQL and others
Checkout list of all the video courses in PrepInsta Prime Subscription
- Directional Senses – Questions | Formulas | How to Solve Quickly | Tricks & Shortcuts
- Blood Relations – Questions | Formulas | How to Solve Quickly | Tricks & Shortcuts
- Odd Man Out – Questions Formulas | How to Solve Quickly | Tricks & Shortcuts
- Directional Senses – Questions | Formulas | How to Solve Quickly | Tricks & Shortcuts
Login/Signup to comment
IMAGES
VIDEO
COMMENTS
Therefore, it is important to practice Venn Diagrams Questions along with the Tips and Tricks for Venn Diagrams. For example - A contains all the people that like cake. Set B represents all the people who like ice cake and set C represents all the people who like chips. Then the region marked as AB represents all the people who like both cake ...
How to solve Venn diagram questions. In middle school, sets and set notation are introduced when working with Venn diagrams. A set is a collection of objects. We identify a set using braces. For example, if set A contains the odd numbers between 1 and 10, then we can write this as:
Therefore, we are going to cover the key concepts of the Venn diagram logical reasoning along with the solved examples, practice questions for competitive exams, tips and tricks, and more. Read the article till the end to clear all the doubts and to be able to solve Venn Diagram Reasoning Questions.
Two Statements and Two Conclusions. 'Syllogism' checks basic aptitude and ability of a student to derive inferences from given statements using Venn diagrams and reasoning r solving problems. Four types of statements : (i) All A is B. (ii) Some A is B. (iii) Some A is not B. (iv) No A is B.
We recommend that you first take a test where you will see the explanation after answering each question or at the end of the test. This way you can first see what kinds of questions occur and how to solve them. Time: 4:00. Number of questions: 10. Start Venn Diagrams Free Practice Test. After the free practice aptitude test, you can use the ...
Type 1. When all the items in the question, belong from the different group then you can solve the question by drawing the Venn diagram, will be like: Explanation: Pen, Book and Keyboard belong from the different group then there is no relationship between the item/s. So, all the three items will be represented in three separate circles.
Venn diagram questions with solutions are given here for students to practice various questions based on Venn diagrams.These questions are beneficial for both school examinations and competitive exams. Practising these questions will develop a skill to solve any problem on Venn diagrams quickly.. Venn diagrams were first introduced by John Venn to represent various propositions in a ...
How To Solve Venn Diagrams Questions. A Venn diagram is an illustration of common characteristics. Maths logic a diagram in which mathematical sets or terms of categorical statement are represented by overlapping circles within a boundary representing the universal set, so that all possible combinations of the relevant properties are represented by various distinct areas in picture.
How to solve Venn diagram questions. In KS3, sets and set notation are introduced when working with Venn diagrams. A set is a collection of objects. We identify a set using curly brackets. For example, if set \mathrm{A} contains the odd numbers between 1 and 10 , then we can write this as: A = \{1, 3, 5, 7, 9\}.
1. PracticeVenn DiagramsQuestions & Answers. To better their understanding of venn diagrams concepts and enhance their ability to answer questions quickly and accurately, candidates should engage in regular practice of venn diagrams questions. Importance: Low. Difficulty level:1 out of 5 (Easy) Examination:SSC, Banking, GMAT, GRE, SAT, CAT, etc.
With practice, you will become more comfortable using Venn diagrams to solve more complex problems. Tips and Tricks to Solve Venn Diagram Questions Efficiently. When it comes to solving Venn diagram questions efficiently, there are several tips and tricks that can help you save time and ensure accuracy. Here are some strategies to consider: 1.
Example 2: If the first word is related to second word and second word is related to third word. Then they will be shown by diagram as given below. Unit, Tens, Hundreds. Ten units together make one Tens or in one tens, whole unit is available and ten tens together make one hundreds. Example 3:
On this page we will discuss questions related to Venn Diagrams. Venn diagram Usually, it is used to represent the set interactions. It uses overlying circles or more figures to demonstrate the rational relationships among two or more items. So accordingly, Venn Diagrams are quite important in both quantitative and logical reasoning.
Another type of questions asked from this topic is based on maxima and minima. We have discussed this type in the other article. Key Learning: It is important to carefully list the conditions given in the question in the form of a Venn diagram. While solving such questions, avoid taking many variables.
Subscribe @ http://bit.ly/2GyZBjc and press the 🔔 Bell icon to get regular updates from our Channel.About us:TalentSprint Aptitude Prep channel is designed ...
In these questions, three elements will be given which may or may not have the same link. Based on the relationship between the individual elements, we have to identify the diagram in which these elements would fit into. So, you have to practice a lot of different examples to identify a suitable relationship and the correct diagram.
Generally there is a 5 questions set from this chapter. Today I am going to use Venn Diagrams in various other chapters. Ques 1 - How many numbers are there between 1 and 100 that are not divisible by 2, 3 and 5 ? Solution - We can solve this question by drawing a Venn diagram. From the above diagram it is clear that (27+14+7+7+13+3+3 = 76 ) 76 ...
Venn Diagram Most Important Questions for Exam | Maths By Shantanu Shukla | Venn Diagram for Bank Exams 2023 | Bank Exams 2023 Preparation Videos #bankexams2...
Tips and Tricks for Venn Diagrams. Venn Diagrams are a schematic and identical way of representing the elements of a set or a group. In mathematical language, it represents the intersection of the two groups. So accordingly, Venn Diagrams are quite important in both quantitative and logical reasoning. Therefore, it is important to practice Venn
Aptitude Questions on Venn Diagrams Set 1. Aptitude questions and quiz on Venn Diagrams. These are meant for those who are preparing for bank exams, GATE Exam, NTSE and other Mental Ability Exams. This is quiz no. 1 in this series. Last Reviewed and Updated on February 7, 2020, Category: Venn Diagrams.
Venn Diagram Questions are asked in the logical reasoning section and carry a good weightage in the CAT exam. Venn diagrams test your logical reasoning skills and IQ level. Several questions in this category use daily life examples around you. As many students come from non-maths backgrounds, the questions on venn diagrams are structured at a ...
Explanation: From the above statements it is clear that some humans are rich and all rich are man, therefore there is a possibility that some some humans are man. 2.) Venn Diagram method. The Venn diagram method allows the test taker to solve the questions diagrammatically. This method is very useful in solving syllogism questions.
The aim of these Venn diagram questions is to check how we relate the given information. This article explains how to relate and draw a Venn diagram for the given information. Sample questions are solved at the end of the article. Concepts 1. When all the items of a group don't belong to each other they can be represented as follows. 2.