- Home |
- About |
- Contact Us |
- Privacy |
- Copyright |
- Shop |
- 🔍 Search Site
- Easter Color By Number Sheets
- Printable Easter Dot to Dot
- Easter Worksheets for kids
- Kindergarten
- All Generated Sheets
- Place Value Generated Sheets
- Addition Generated Sheets
- Subtraction Generated Sheets
- Multiplication Generated Sheets
- Division Generated Sheets
- Money Generated Sheets
- Negative Numbers Generated Sheets
- Fraction Generated Sheets
- Place Value Zones
- Number Bonds
- Addition & Subtraction
- Times Tables
- Fraction & Percent Zones
- All Calculators
- Fraction Calculators
- Percent calculators
- Area & Volume Calculators
- Age Calculator
- Height Calculator
- Roman Numeral Calculator
- Coloring Pages
- Fun Math Sheets
- Math Puzzles
- Mental Math Sheets
- Online Times Tables
- Online Addition & Subtraction
- Math Grab Packs
- All Math Quizzes
- 1st Grade Quizzes
- 2nd Grade Quizzes
- 3rd Grade Quizzes
- 4th Grade Quizzes
- 5th Grade Quizzes
- 6th Grade Math Quizzes
- Place Value
- Rounding Numbers
- Comparing Numbers
- Number Lines
- Prime Numbers
- Negative Numbers
- Roman Numerals
- Subtraction
- Add & Subtract
- Multiplication
- Fraction Worksheets
- Learning Fractions
- Fraction Printables
- Percent Worksheets & Help
- All Geometry
- 2d Shapes Worksheets
- 3d Shapes Worksheets
- Shape Properties
- Geometry Cheat Sheets
- Printable Shapes
- Coordinates
- Measurement
- Math Conversion
- Statistics Worksheets
- Bar Graph Worksheets
- Venn Diagrams
- All Word Problems
- Finding all possibilities
- Logic Problems
- Ratio Word Problems
- All UK Maths Sheets
- Year 1 Maths Worksheets
- Year 2 Maths Worksheets
- Year 3 Maths Worksheets
- Year 4 Maths Worksheets
- Year 5 Maths Worksheets
- Year 6 Maths Worksheets
- All AU Maths Sheets
- Kindergarten Maths Australia
- Year 1 Maths Australia
- Year 2 Maths Australia
- Year 3 Maths Australia
- Year 4 Maths Australia
- Year 5 Maths Australia
- Meet the Sallies
- Certificates

Tally Chart Worksheets
Welcome to our Tally Chart Worksheets for 1st and 2nd graders. Here you will find a wide range of free tally chart sheets which will help your child learn to record information in a tally chart and count numbers in tally charts.
For full functionality of this site it is necessary to enable JavaScript.
Here are the instructions how to enable JavaScript in your web browser .
Quicklinks to ...
What is a Tally Chart?
- More related resources
Tally Chart Online Quiz
A Tally Chart is a way of count objects. It is most effective when recording 'live' data one item at-a-time.
For example, traffic surveys recording the type of vehicle passing a point; doing a class survey where you ask one person at a time.
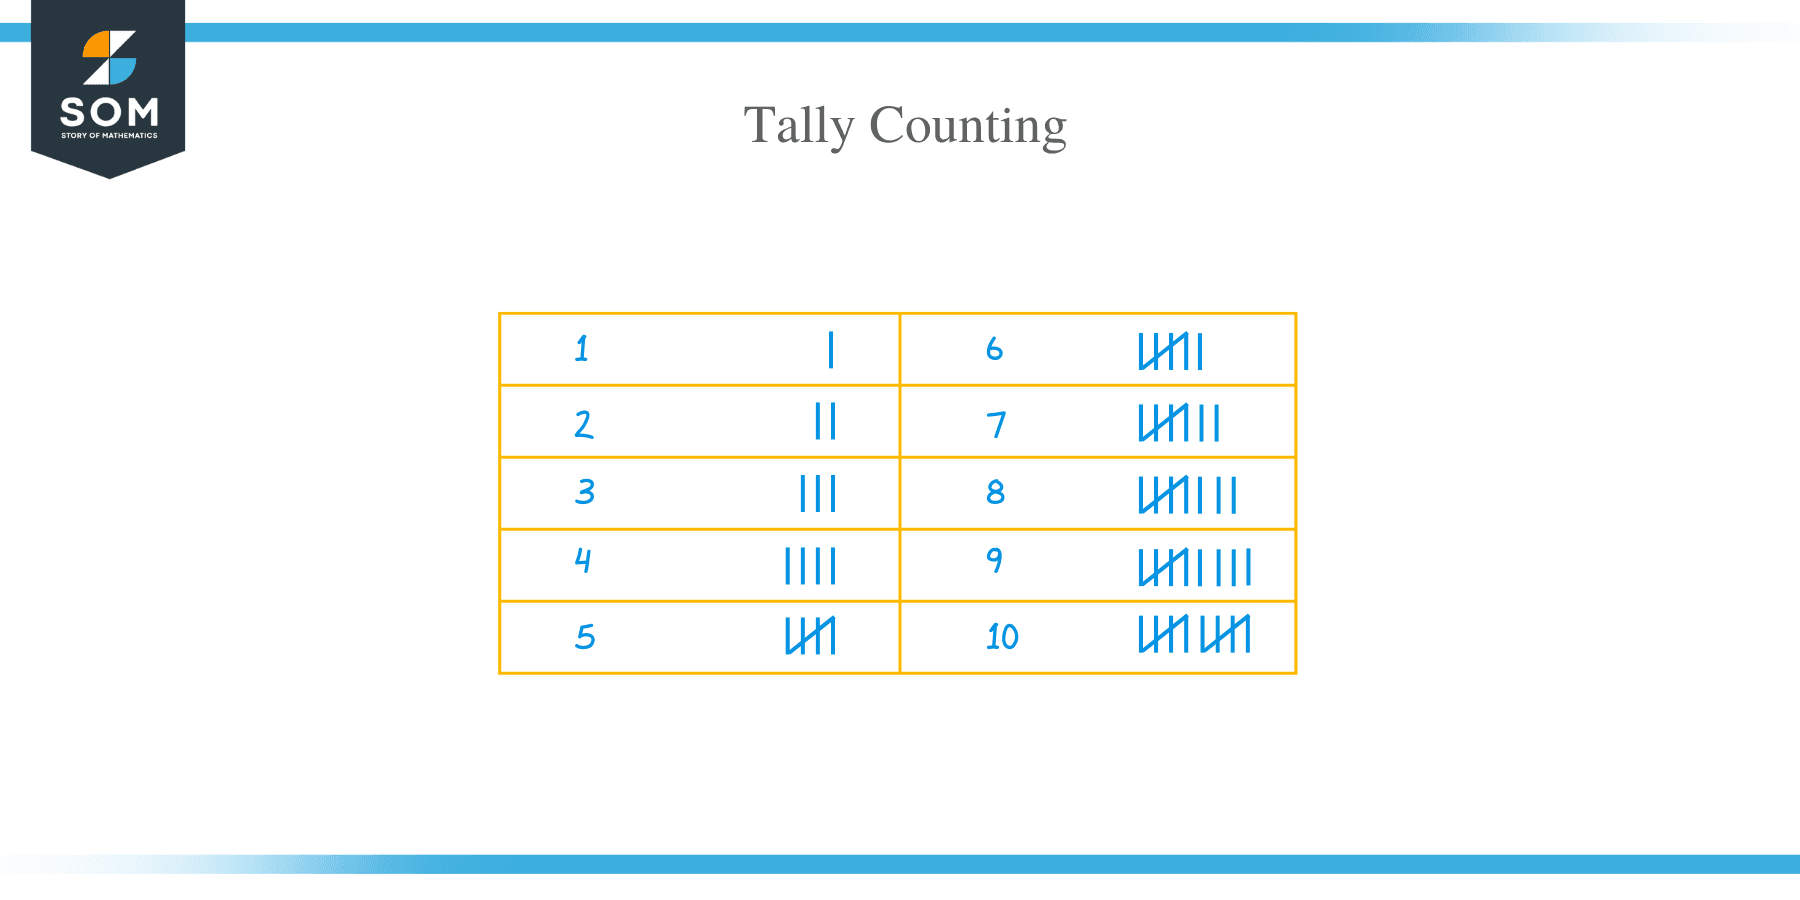
The tally is recorded with a straight vertical line representing each item of data and the fifth item is made by crossing the previous 4 lines (shown below).
This makes the job of counting all the data up at the end much quicker and less prone to error.
You can see in the example below the difference it makes when the tally is made in groups of 5 (top example) compared to the bottom example which is just in 1s.
Not only is the tally much quicker to count, but it is also far easier to get an accurate result.
Tally Chart Example
Below is an example of an bug survey which a group did during a bug hunt.
Each time a bug was seen it was recorded in the chart.
The data is recorded in a tally, and the tally is totalled at the end of the bug hunt.
There are several different skills involved in using and understanding tally charts which our worksheets cover:
- converting a tally into a number;
- recording numbers as a tally;
- counting different data items and recording them correctly in a tally.
These sheets are aimed at kids in 1st and 2nd grade.
We have split our worksheets into 3 sections to deal with these skills:
- The first section contains sheets to convert a tally into a number;
- The second section contains sheets to convert a number into a tally;
- The third section (which is harder) involves collecting data items and recording them correctly as a tally, then counting them up.
Count the Tally Worksheets
- Count the Tally Sheet 1
- PDF version
- Count the Tally Sheet 2
Tally the Number Worksheets
- Tally the Number Sheet 1
- Tally the Number Sheet 2
Count and Tally Worksheets
- Count and Tally Sheet 1
- Count and Tally Sheet 2
- Count and Tally Sheet 3
- Count and Tally Sheet 4
- Blank Tally Chart Template
Need a tally chart template to collect your own data?
Try our blank tally chart template below!
More Recommended Math Worksheets
Take a look at some more of our worksheets similar to these.
First Grade Bar Graph Worksheets
Here is our selection of bar graphs for first graders.
These sheets involve reading and interpreting a range of bar graphs and picture graphs with a scale going up in ones.
Using these sheets will help children to understand how bar graphs work.
- Count and Graph Worksheets
- Bar Graphs First Grade
2nd Grade Bar Graph Worksheets
These sheets involve reading and interpreting a range of bar graphs and picture graphs with a scale going up in ones or twos.
Draw missing bars on a bar graph to the correct height.
Use the information in a bar graph to add data into a table.
Using the link below will open the 2nd grade Math Salamanders website in a new browser window.
- Bar Graphs 2nd Grade
- First Grade Measurement Worksheets
Here is our selection of measurement worksheets for 1st grade.
These sheets involve reading scales going up in ones to find the weight or liquid capacity.
Using these sheets will help children to consolidate their counting as well as learning to read a simple scale.
Our quizzes have been created using Google Forms.
At the end of the quiz, you will get the chance to see your results by clicking 'See Score'.
This will take you to a new webpage where your results will be shown. You can print a copy of your results from this page, either as a pdf or as a paper copy.
For incorrect responses, we have added some helpful learning points to explain which answer was correct and why.
We do not collect any personal data from our quizzes, except in the 'First Name' and 'Group/Class' fields which are both optional and only used for teachers to identify students within their educational setting.
We also collect the results from the quizzes which we use to help us to develop our resources and give us insight into future resources to create.
For more information on the information we collect, please take a look at our Privacy Policy
We would be grateful for any feedback on our quizzes, please let us know using our Contact Us link, or use the Facebook Comments form at the bottom of the page.
This quiz tests your knowledge and ability to use and understand tally charts.
How to Print or Save these sheets 🖶
Need help with printing or saving? Follow these 3 steps to get your worksheets printed perfectly!
- How to Print support
Return to First Grade Math Hub
Return to Statistics Worksheets
Return from Tally Chart Worksheets to Math Salamanders Homepage
Math-Salamanders.com
The Math Salamanders hope you enjoy using these free printable Math worksheets and all our other Math games and resources.
We welcome any comments about our site or worksheets on the Facebook comments box at the bottom of every page.
New! Comments
TOP OF PAGE
© 2010-2024 Math Salamanders Limited. All Rights Reserved.
- Privacy Policy
- Copyright Policy

- Mathematicians
- Math Lessons
- Square Roots
- Math Calculators
- Tally chart – Explanation & Examples
JUMP TO TOPIC
What is the tally chart?
How to make a tally chart, how to read a tally chart, practical questions, tally chart – explanation & examples.
“The tally chart is a chart used to record and count the frequencies of your data using tally marks”
In this topic, we will discuss the tally chart from the following aspects:
The role of a tally chart
We use a tally chart to record and count the frequencies of our data. Each occurrence of any value or category is shown by a tally mark, and every fifth tally is drawn vertically to make a collection of five. The collections of 5 tallies are used to give the frequency.
- Each unique category or value is placed in the first column on the left).
- When any value occurs, a tally mark is added to the chart in front of the value or category name. Every fifth tally is drawn vertically to make a collection of five.
If we count these tallies and add a frequency column, we will have this table
We see from this chart that “Former smoker < 1 year quitting” is the most frequent category in these individuals with 7 occurrences. Also, “Former smoker >= 1 year quitting” is the least frequent category in these individuals with only 2 occurrences.
Another example, the following is a tally chart of the weights of 20 individuals.
Here, we see that the weight of 66 Kg is the most frequent in these individuals with 7 occurrences. The weight of 68 kg is the least occurring value with only 1 occurrence.
The tally chart is read by multiplying the bundles of tallies by 5 and adding the individual tallies to obtain the frequency of each value or category.
As an example, the following is a tally chart of the heights (in cm) of 300 individuals. We want to determine the frequency of each height.
To determine the frequency of the 175 cm height, there are 6 bundles of 5 tallies so the frequency = 6 X 5 = 30.
There are 9 bundles of 5 tallies for the 168 cm height and a single tally, so the frequency of 168 cm height = 9 X 5 = 45+1 = 46.
There are 9 bundles of 5 tallies for the 151 cm height, so the frequency of 151 cm height = 9 X 5 = 45.
There are 6 bundles of 5 tallies for the 153 cm height and two single tallies, so the frequency of 153 cm height = 6 X 5 = 30+2 = 32.
We can follow the same procedure for other heights to determine their frequency and produce the following table.
We see that the most frequent height in these 300 individuals is 168 cm with 46 occurrences.
By looking at the bundles of tallies, the tally chart gives us the most frequent value in our data. The most frequent value is known as the mode .
The mode is a type of summary statistics that gives important information about a certain data or population.
For the example of heights above, the most frequent value was 168 cm, so we know that 168 cm is the mode or the most frequent height among these 300 individuals.
In the other example of smoking habits, the tally chart tells us that “Former smoker < 1 year quitting” is the mode or the most frequent category among these 20 individuals.
The mode is not necessarily unique to a given data, since certain numbers or categories may occur the same maximum value. In that case, the data is called multimodal data as opposed to unimodal data with only one unique mode.
A common example of multimodal data when you have a mixed population. For example, if you have data of individual heights from a certain school, the data obtained, mostly, will be bimodal with one mode for students and the other mode for teachers.
1.The following is a tally chart for the names of 30 females.
What is the most frequent name? What is its frequency?
2.The following is a tally chart for the names of 40 males.
What is the most frequent name? what is the least frequent name?
3.The following is a tally chart for the body mass index (BMI) of 20 individuals
What is the most frequent value? Create a frequency distribution table for these numbers?
4.The following is a tally chart for the marital status of 50 individuals
What is the least frequent marital status? What is its frequency?
5.The following is a tally chart for the religion of 100 individuals
What is the most frequent religion? What is the least frequent religion?
- The most frequent name is Kathryn. It has a frequency of 12 times.
- The most frequent name is Marcus. It occurs 10 times. The least frequent name is Cary which occurs only once.
- The most frequent BMI value is 24.3 with 9 occurrences. Here is the frequency table.
4.The least frequent marital status is “Separated” with only 1 occurrence.
5.The most frequent religion is “Protestant- Christian” with 45 occurrences. The least frequent religion is “Buddhism” with only 3 occurrences.
Previous Lesson | Main Page | Next Lesson

Home / United States / Math Classes / 1st Grade Math / Problems based on Tally chart, Bar graph and Picture graph
Problems based on Tally chart, Bar graph and Picture graph
Tally charts, bar graphs, and picture graphs can be used to represent the count of things in an efficient manner. These methods help us organize information collected by observation. Learn how to use tally charts, bar graphs, and picture graphs to represent data by solving some real-life problems. ...Read More Read Less
Table of Contents

Tally chart
Picture chart, what are the uses of representing data, solved examples.
- Frequently Asked Questions
A tally chart is a method to present information where the data is recorded using different sets of vertical dashes. A single dash signifies the counting of a single item.
Every time an object is observed or counted a dash is drawn next to the previous dash till the number of dashes reaches four.
When the counted number of items crosses five, four dashes are followed by a diagonal dash that cuts across the four lines that were previously drawn.

Another way to present information is using bar graphs . In this case, different rectangular bars are placed side by side. Each bar signifies different items that are considered. The length of each bar signifies the repeated number of each item.

A picture chart is another method of displaying data. Here we see a picture that represents a particular object. As the number of objects increases, so does the picture depicting the same.

We can display data in different forms to allow easy interpretation of information. Numbers are usually in the form of symbols. A person who views the numbers cannot understand them in comparison to other values. When using data representations like the ones we talked about like tally marks, bar graphs and picture graphs, we can easily view and compare the different values.
Any of these forms of data representation can be used at any point in time.
A class of students was asked what they aspired to become when they grew up. The teacher recorded their responses in the form of tally marks, a bar graph as well as in the form of a picture chart. Here’s what the representations looked like.
Tally marks:

Picture chart:

Example 1 : Given below is a table that has the tally scores of the favorite pets of a set of students.
- Among the three pets, which pet is most preferred by the majority of the class?
- Which is the pet that was chosen least often as the favorite pet?

The pet that is most often chosen as the favorite pet of the students is the cat. Ten students chose the same.
The pet that is chosen as the favorite by the least number of students is the dog. Four students chose the dog as their favorite animal.
Example 2 : The students of a class of 25 students enrolled for a few activities. The remaining students are to be enrolled in the archery club.
- Find the number of students to be enrolled in the archery club. Depict the same in the blank column given below.
- From the table, which is the least picked activity.

There are a total of 25 students.
The number of students that enrolled in the activities given above = 4 + 7 + 3 + 4 = 18
The number of students that will be enrolled in the archery club = 25 – 18 = 7

The club that is least preferred is the sculpture club.
Example 3 : A fast-food restaurant was asked to make a list of the food items sold on a particular day.
- Which food item is the most preferred?
- How many food items of the lesser preferred ones should be added to match up to the number of the most preferred food item sold?

Pizza is the most preferred food item. Nine pizzas were sold on that day.
For the french fries to match up the number of the pizzas sold we deduct the total number of the french fries sold from the total number of pizzas.
7 – 6 = 1
So, one more set of french fries should be added to the existing number to match up to the number of pizzas that were sold on that day.
For the burgers to match up to the total number of pizzas, deduct the total number of burgers from pizzas.
7 – 3 = 4
So, this means that three burgers should be added to the total number of burgers to match up to the number of pizzas that were sold on that day.
Which of the three types of representation is the best?
All the three forms of data representation, tally charts, bar graphs, and picture graphs, are useful according to the need and the how immediately the data is needed. For example, the tally marks are useful where the observations need to be recorded spontaneously. The bar graph or the picture graph is used when a visual representation of some data already collected is required.
Where can tally marks be used?
Imagine a scenario where you are asked to count the number of balls that are being dropped from a place of height. In this scenario where the action is happening simultaneously, using a single line to represent each ball is more convenient than writing down a list of numbers.
Check out our other courses
Grades 1 - 12
Level 1 - 10
Tally Marks
Tally Marks are used to keep a track of numbers in the quickest possible way. Tally marks are used for counting and are represented as a set of five lines in which there are four vertical lines (one vertical line is made for each of the first four numbers) and the fifth number is represented by a diagonal line across the previous four numbers.
What are Tally Marks?
Tally marks are used for counting and are a part of the unary numeral system. They are also known as hash marks and they are used throughout the world for a visual representation of grouped observations. Tally marks are mostly used to keep the record of a running count. These marks are generally used for counting scores, points, number of people, etc. It is a method of collecting data that can be arranged in a tabular form. A tally mark is represented with the symbol " | ". Thus, tally marks make counting easier.
Counting Tally Marks

Tally Marks Chart
When the data is represented in a table form with tally marks, that table is known as a tally mark chart. A tally mark chart helps to give a clear view of data. Tally marks on the chart are the easiest way of keeping track of numbers in groups of five. Let's understand the tally mark chart with help of an example. For example, the chart given below is made by a pizza seller which shows one column of "day" and the other column of "pizzas sold on each day". The seller marked the number of pizzas sold on each day with tally marks instead of counting. Tally marks are marked in the pizzas sold column. Let's find out pizzas sold on Monday and Friday.

Uses of Tally Marks
Tally marks are used to find the frequency of a set of data values with ungrouped raw data. Since manually making and counting the observations or class intervals of every raw data and cross-checking all the data is time-consuming. Hence, to reduce the manual work, tally marks is used. The raw data needs to be changed and shown in the form of tally marks. Each frequency number is identified in the form of tally marks and finally added to obtain the frequency table. Let us look at an example to understand this better.
Example: Let’s consider the marks of 30 students in standard X in a particular school. The scores are as follows:
68, 73, 84, 61, 76, 73, 60, 61, 84, 82, 68, 76, 76, 84, 90, 88, 78, 60, 76, 64, 74, 63, 65, 81, 90, 92, 85, 77, 88, 90
The maximum mark allotted to the paper is 100. Draw a tally chart for the above data.
Solution: Rearranged data in ascending order:
From the above table, we can see how the tally marks can make it simple to derive the frequency of raw data.
Related Articles
Check out these interesting articles to know more about tally marks and their related topics.
- Data Handling
- Tally Worksheets for Kindergarten
- Tally Marks Worksheets
Tally Marks Examples
Example 1 : Following is the list of chocolates of 30 students of grade V. Musketeers, Snickers, Musketeers, Twix, Musketeers, Hershey’s, Twix, Musketeers, Snickers, Hershey’s, Musketeers, Twix, Twix, Hershey’s, Musketeers, Hershey’s, Twix, Musketeers, Hershey’s, Musketeers, Musketeers, Snickers, Hershey’s, Hershey’s, Twix, Hershey’s, Musketeers, Hershey’s, Twix, Musketeers. (A) Arrange the names of chocolates in a table using tally marks. (B) Which chocolates are preferred by most of the students? Solution: (A) By observing the choices of chocolates of 30 students, we can construct the table as below.

go to slide go to slide go to slide

Book a Free Trial Class
Practice Questions
go to slide go to slide
FAQs on Tally Marks
What is tally marks in statistics.
Tally marks are used for counting and are a part of the unary numeral system. They are used to collect and arrange data in a tabular form. A tally mark is represented with the symbol " | ". They are represented as a set of five lines in which there are four vertical lines (one vertical line is made for each of the first four numbers) and the fifth number is represented by a diagonal line across the previous four numbers.
How is Tally Marks Calculated?
Tally marks are calculated and expressed by vertical lines. The count of one is represented by the symbol '|' tally mark, 2 is represented by '| |' tally marks, 3 is represented by '| | |' tally marks, 4 is denoted by '| | | |' tally marks. They are clustered in groups of five for readability. So for the first four counts, we draw an individual line for each, and for the fifth count, the line goes across the previous four lines. For the sixth count, we will continue drawing individual lines again.
How do you Write 5 in Tally Marks?
In tally marks, the number 5 is written with four vertical lines and a fifth line across the previous four lines. It is also considered as one group in tally marks. For example, using the tally marks, if we want to note that we have 5 chocolates with us, we will just write four straight lines and one slanting line across the four lines to represent the 5 chocolates.
How do you Write 3 in Tally Marks?
The symbol of the tally mark is " | ". The tally mark for number 1 is represented as " | ". The tally mark for the number 2 is represented as " | | ". The tally mark for the number 3 is represented as " | | | ". For example, if we have 3 mobile phones, in order to store it in the tally chart, we will just write " | | | " to denote the number of mobile phones and store our data.
How are Tally Marks Useful?
Tally marks are generally used to maintain the record of a running count. These marks are quite useful in keeping the record of data in the group (set of five lines) like to maintain the record of scores in a game.
What do Tally Marks Look Like?
Tally marks are represented in the form of standing lines that look like the lowercase letter 'l'. It is a method of collecting data and the data can be arranged in a tabular form using tally marks. Tally marks look like a tabular representation with vertical and slanting lines arranged in order to store our data.
What is a Tally Marks Chart?
A tally marks chart is used to represent the data in a table. It helps to give a clear picture of data along with tally marks. We can easily count the observations with help of a tally mark chart.

- Home Learning
- Free Resources
- New Resources
- Free resources
- New resources
- Filter resources
- Childrens mental health
- Easter resources
Internet Explorer is out of date!
For greater security and performance, please consider updating to one of the following free browsers
Make Tally Charts Lesson
This Year 2 Make Tally Charts lesson covers the prior learning of counting in 5s, before moving onto the main skill of recording data using tally charts.
The lesson starts with a prior learning worksheet to check pupils’ understanding. The interactive lesson slides recap the prior learning before moving on to the main skill. Children can then practise further by completing the activities and can extend their learning by completing an engaging extension task.
National Curriculum Objectives Mathematics Year 2: (2S1) Interpret and construct simple pictograms, tally charts, block diagrams and simple tables
Mathematics Year 2: (2S2a) Ask and answer simple questions by counting the number of objects in each category and sorting the categories by quantity
Mathematics Year 2: (2S2b) Ask and answer questions about totalling and comparing categorical data
Get the most from lessons!

Resources for teachers

Interactive activities for children
2 Teaching Support
Lesson Slides
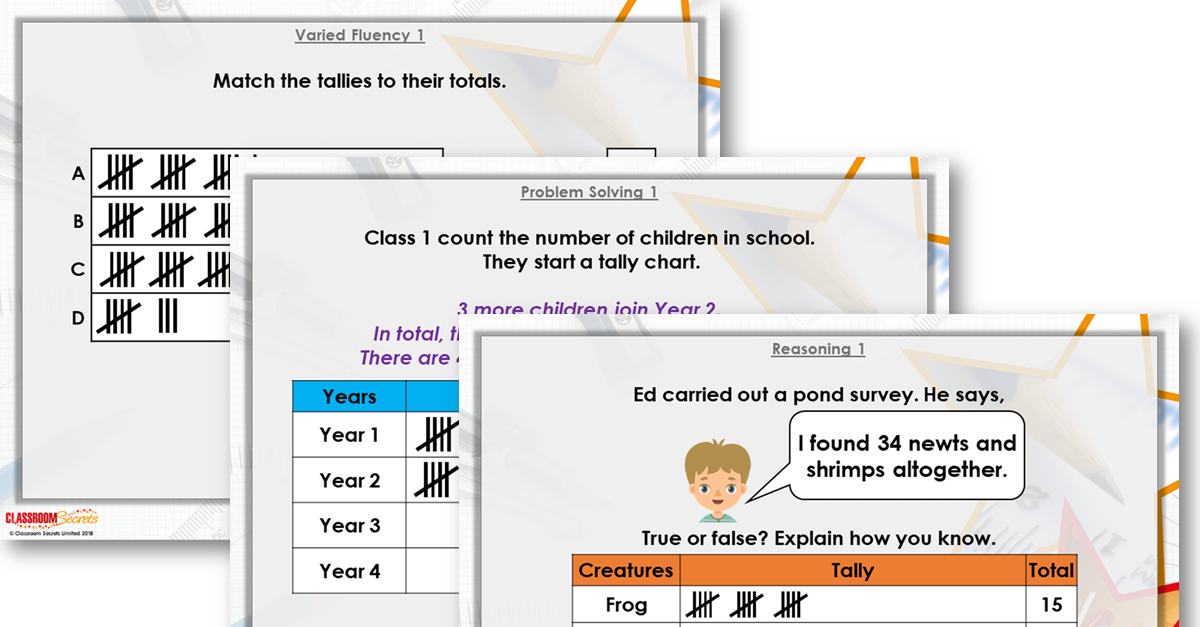
These lesson slides guides pupils through the prior learning of counting in 5s, before moving onto the main skill of make tally charts. There are a number of questions to check pupils' understanding throughout.
Modelling Powerpoint
This powerpoint can be used to model the questions that the children will complete on the Varied Fluency and Reasoning & Problem Solving worksheets as part of this lesson.
These are the same as the lesson slides on Classroom Secrets. You can assign this as an activity for pupils to access individually in school or remotely from home.
Video Tutorial
In this Interpreting Data Video Tutorial, Katie shows pupils how to use tally charts and block diagrams.
1 Prior Learning
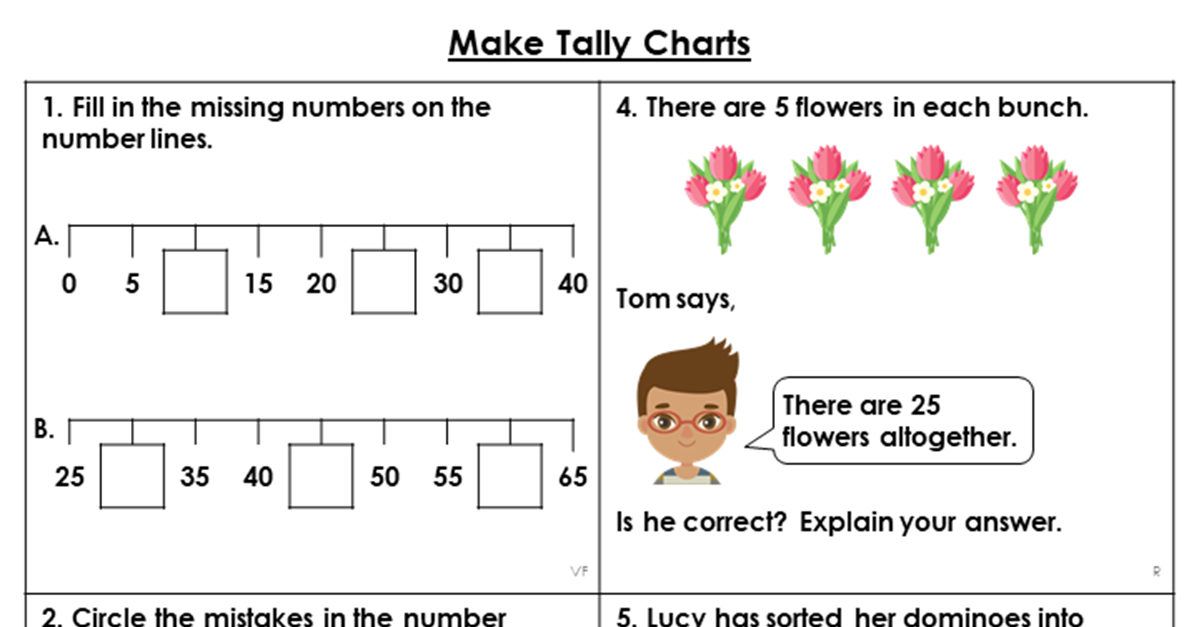
This worksheet recaps prior learning of counting in 5s, before moving onto the main skill of recording data using tally charts.
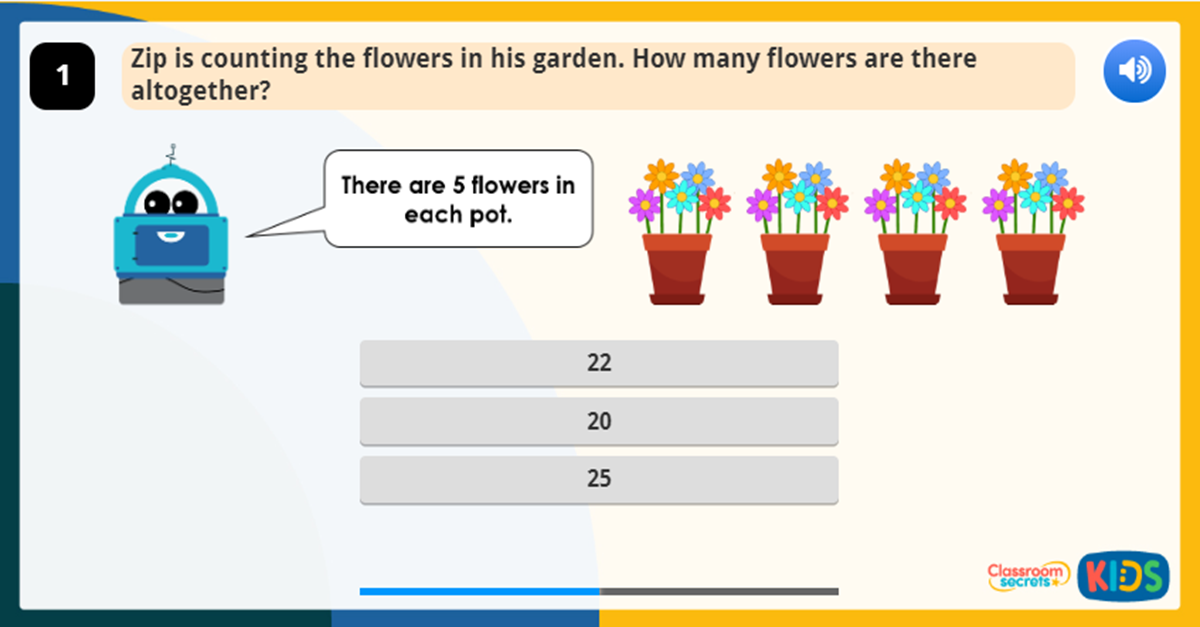
Interactive Activity
This Year 1 Count in 5s Activity checks pupils' understanding of counting in multiples of 5.
2 Varied Fluency
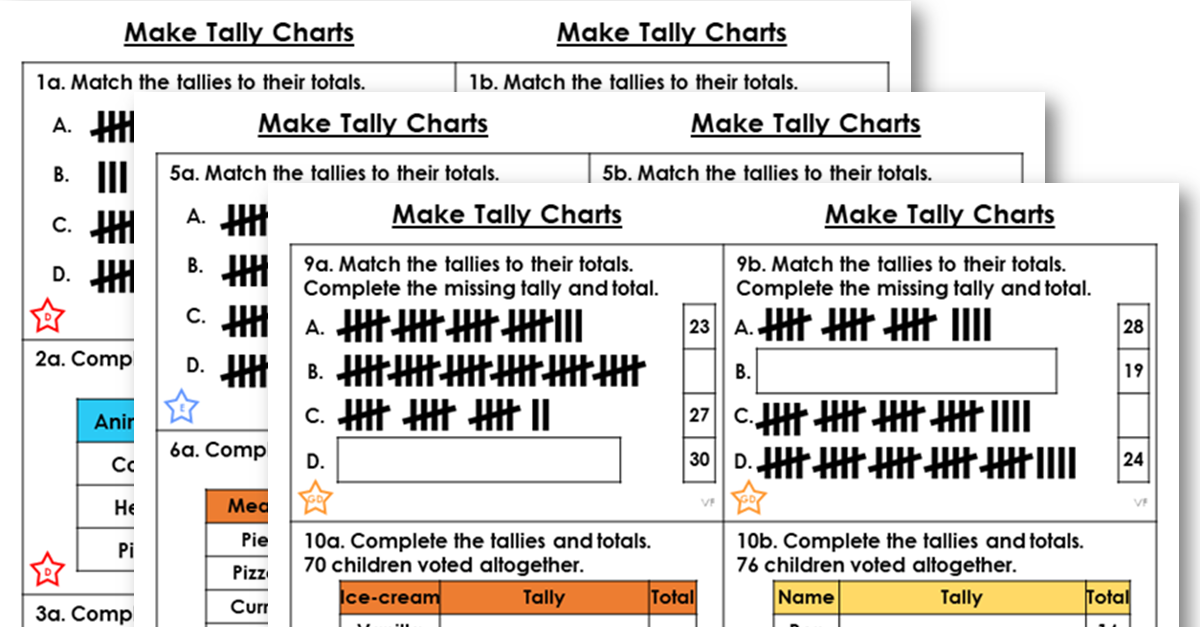
This differentiated worksheet includes varied fluency questions for pupils to practise the main skill of this lesson.
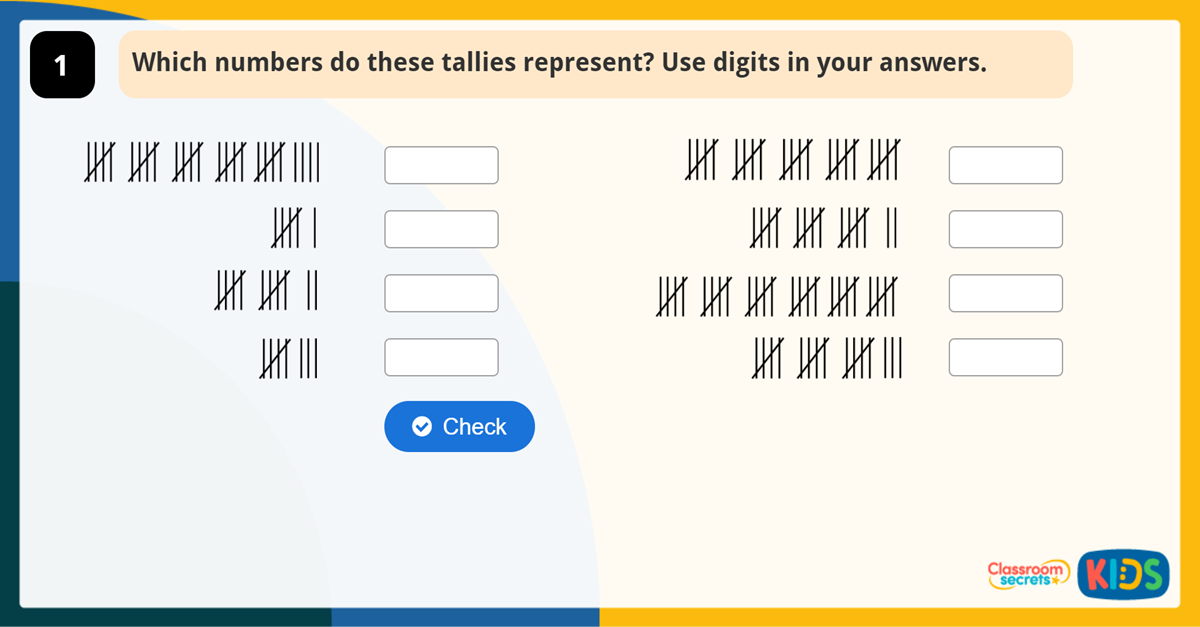
This Year 2 Tally Charts Game aims to support pupils' understanding of reading and interpreting charts.
2 Reasoning & Problem Solving
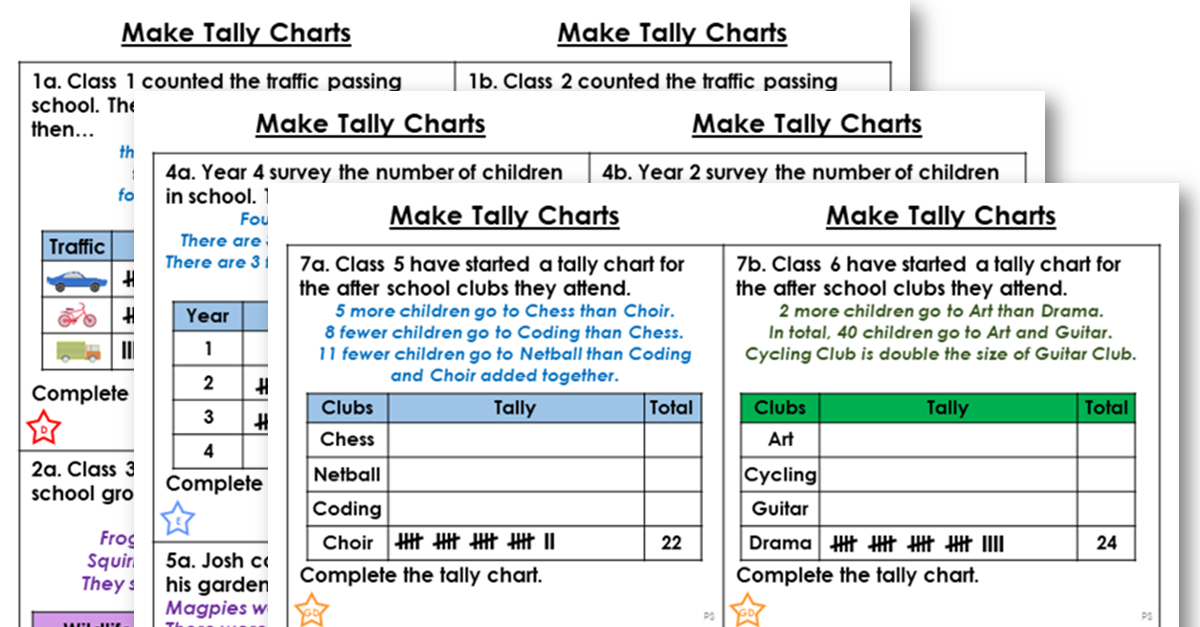
This differentiated worksheet includes reasoning and problem solving questions to support the teaching of this step.
Discussion Problem
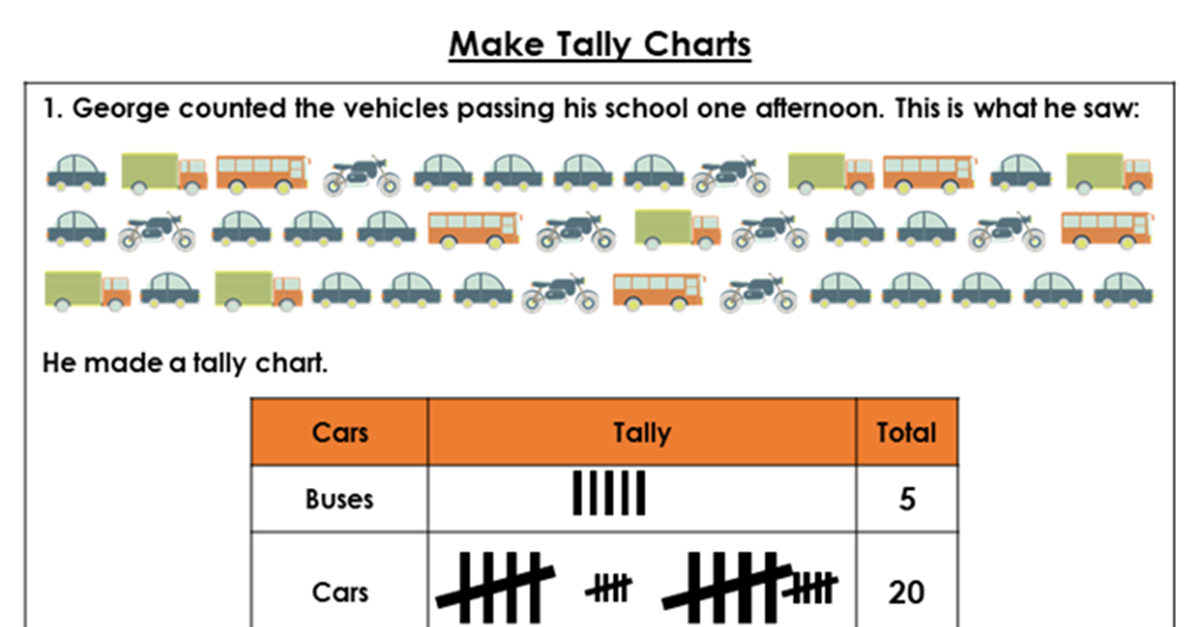
This worksheet includes two discussion problems which can be used in pairs or small groups to further pupils' understanding of the concepts taught in this lesson.
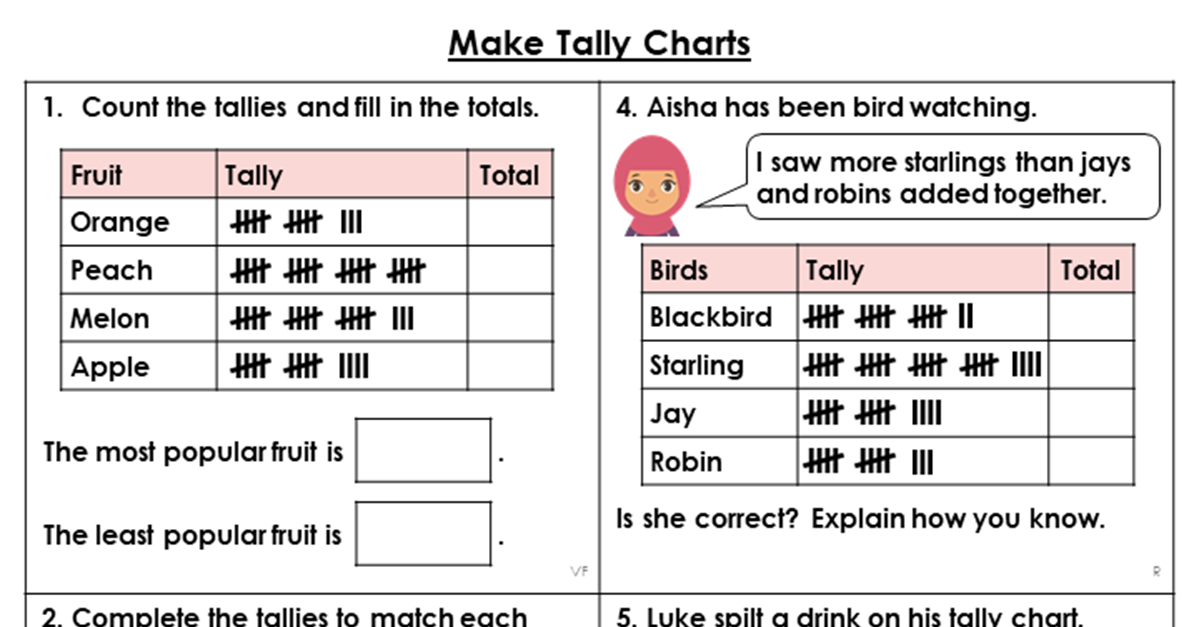
Mixed Practice
This worksheet includes varied fluency, reasoning and problem solving questions for pupils to practise the main skill of make tally charts.
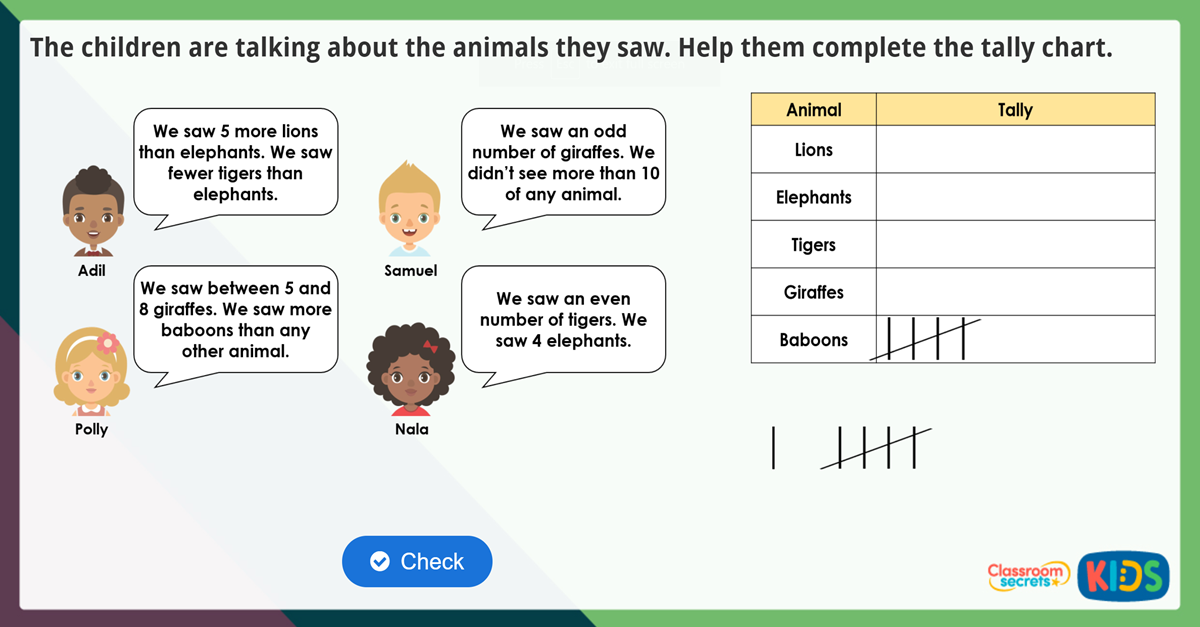
This Year 2 Create Tally Charts Maths Challenge aims to extend pupils' understanding of statistics.
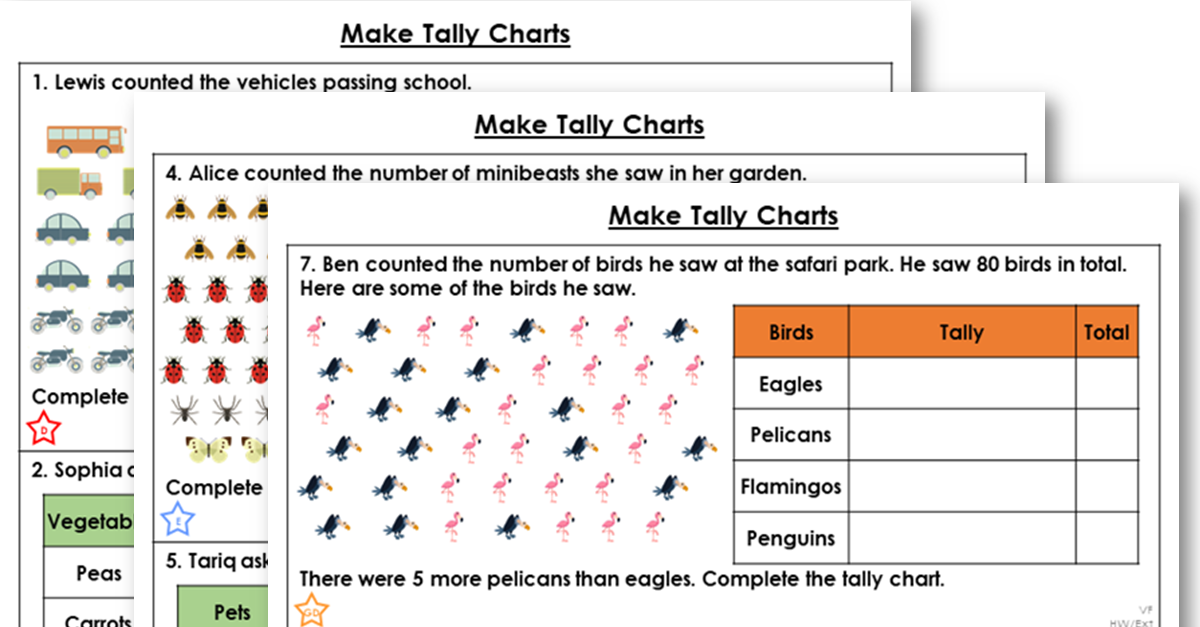
This differentiated worksheet includes varied fluency and reasoning and problem solving questions to support the teaching of this step.
2 Additional Activities

Free Consolidation of Steps 1-3 Year 2 Statistics Learning Video Clip
Join us at Superhero HQ where Colin, senior administrator for the headquarters is busy collecting data from the superheroes of Merton City.
Subscription
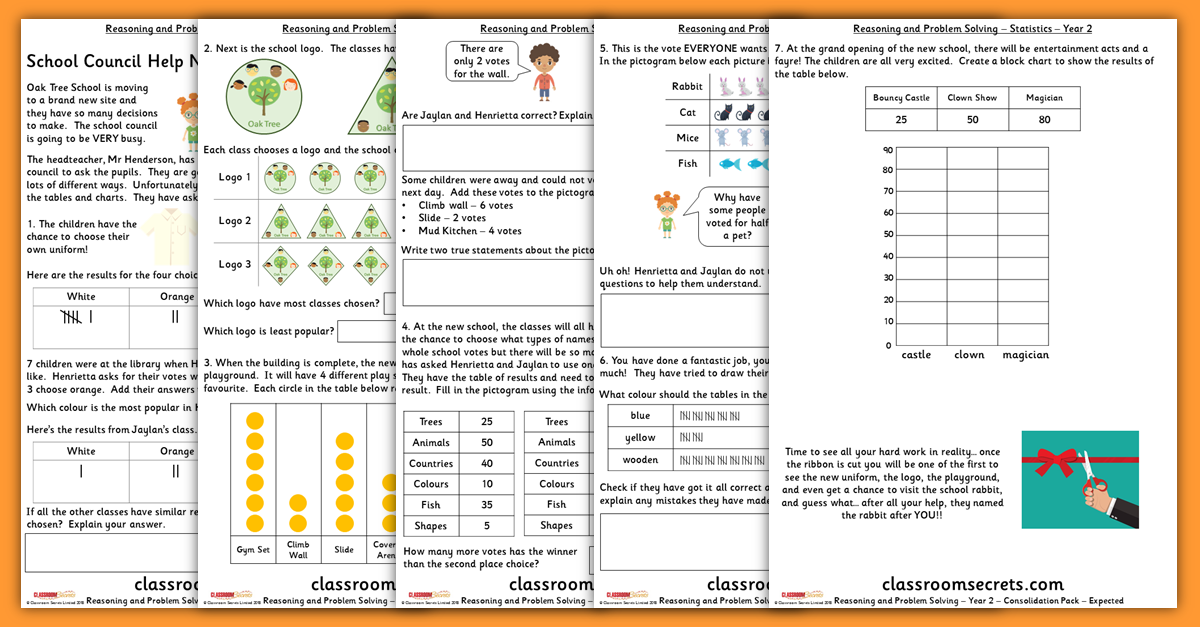
Consolidation Pack
These Statistics worksheets are fantastic at helping your pupils practice their reasoning and problem solving skills. This pack contains two different question types for Year 2 Spring Block 2.

Home Learning Pack
This Spring week 5 Maths pack contains varied fluency, reasoning and problem solving worksheets
D Download Packs
Stay in touch.
01422 419608
[email protected]
Interested in getting weekly updates from us? Then sign up to our newsletter here!

Information

- Cookie Policy
- Privacy Policy
- Terms and Conditions
Copyright: Classroom Secrets 2024
Company number: 8401067
VAT number: 248 8245 74
- Terms & Conditions
Designed by Classroom Secrets
Tally Worksheets
- Kindergarten

- Child Login
- Number Sense
- Measurement
- Pre Algebra
- Figurative Language
- Reading Comprehension
- Reading and Writing
- Science Worksheets
- Social Studies Worksheets
- Math Worksheets
- ELA Worksheets
- Online Worksheets
Browse By Grade
- Become a Member

- Kindergarten

- Skip Counting
- Place Value
- Number Lines
- Subtraction
- Multiplication
- Word Problems
- Comparing Numbers
- Ordering Numbers
- Odd and Even Numbers
- Prime and Composite Numbers
- Roman Numerals
- Ordinal Numbers

- Big vs Small
- Long vs Short
- Tall vs Short
- Heavy vs Light
- Full and Empty
- Metric Unit Conversion
- Customary Unit Conversion
- Temperature

- Tally Marks
- Mean, Median, Mode, Range
- Mean Absolute Deviation
- Stem and Leaf Plot
- Box and Whisker Plot
- Permutations
- Combinations

- Lines, Rays, and Line Segments
- Points, Lines, and Planes
- Transformation
- Ordered Pairs
- Midpoint Formula
- Distance Formula
- Parallel and Perpendicular Lines
- Surface Area
- Pythagorean Theorem

- Significant Figures
- Proportions
- Direct and Inverse Variation
- Order of Operations
- Scientific Notation
- Absolute Value

- Translating Algebraic Phrases
- Simplifying Algebraic Expressions
- Evaluating Algebraic Expressions
- Systems of Equations
- Slope of a Line
- Equation of a Line
- Quadratic Equations
- Polynomials
- Inequalities
- Determinants
- Arithmetic Sequence
- Arithmetic Series
- Geometric Sequence
- Complex Numbers
- Trigonometry
Tally Marks Word Problems Worksheets
- Statistics >
- Tally Marks >
Run rings around your peers by successfully completing our free tally marks word problems worksheets, which help perfect your techniques for reading tally charts and analyzing data. If you hammer home the fact that a tally chart is a table showing the tally marks for each category, answering the questions after perusing the tally chart will be a cinch. Prove your analytical chops by solving word problems involving addition and subtraction.
This set of printable tally marks word problems pdfs is recommended for students of grade 2 and grade 3.
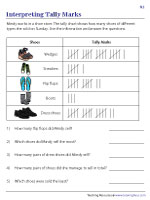
Read and Interpret | Tally Marks Word Problems
Tally marks are an easy and fun way to show data. Put the counting skills of 2nd grade and 3rd grade kids to test by counting the number of lines in the tally chart and use the information in the chart to answer the questions.
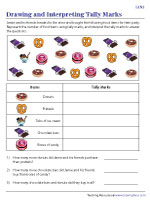
Draw and Interpret | Tally Marks Word Problems
Zoom in on the images in the picture box, count the number of images of each group, draw the correct number of tally marks to represent the total number of items, and answer the questions.
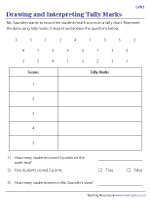
Drawing and Interpreting Tally Marks | Ungrouped Discrete Data
Watch practice pivot toward ungrouped discrete data in this resource on tally marks word problems for grade 2 and grade 3. Read the data, group them by drawing the appropriate number of lines, and answer the questions.
Related Printable Worksheets
▶ Bar Graph
▶ Pictograph
Tutoringhour
What we offer, information.
- Membership Benefits
- How to Use Online Worksheets
- How to Use Printable Worksheets
- Printing Help
- Testimonial
- Privacy Policy
- Refund Policy
Copyright © 2024 - Tutoringhour
You must be a member to unlock this feature!
Sign up now for only $29.95/year — that's just 8 cents a day!
Printable Worksheets
- 20,000+ Worksheets Across All Subjects
- Access to Answer Key
- Add Worksheets to "My Collections"
- Create Custom Workbooks
Digitally Fillable Worksheets
- 1100+ Math and ELA Worksheets
- Preview and Assign Worksheets
- Create Groups and Add Children
- Track Progress
Powerful online learning at your pace

Problem-Solving and Productive Struggle
They call it problem-solving for a reason. When students routinely engage in productive struggle, they become problem solvers!
This post contains affiliate links, which simply means that when you use my link and purchase a product, I receive a small commission. There is no additional cost to you, and I only link to books and products that I personally use and recommend.
There is an amazing book called Adding It Up: Helping Children Learn Mathematics . It is not a new book (Copyright 2001), nor is it an easy book to read. I waded through it once a few years back. The book takes a hard look at the state of mathematics instruction in the United States through the lens of the Third International Mathematics and Science Study (TIMSS) conducted in the mid-1990s. Throughout the book, comparisons are drawn between mathematics instruction in the United States, Japan, and Germany.
One finding of the TIMSS that I found particularly striking, and that has really stuck with me, is the use of problem-solving in United States classrooms. They studied the types of problems used in classrooms in the three countries and, actually, the problems were not significantly different. What was different was the way in which the teachers in each country allowed students to work the problems . Not surprisingly, Japanese teachers typically allow students to struggle the most with problems. Teachers in Germany stepped in to help a little quicker than the teachers in Japan. In the United States, however, teachers typically offered assistance at the first sign of struggle or frustration. In other words, we often deny students the opportunity to engage in productive struggle.
Wait, isn’t it called problem-solving?
So here’s what I want you to think about. How quick are you to jump in and help your students solve their problems? How much do you allow them to struggle? Do you often catch yourself saying, “ But they can solve the problems when they work with me!” ? I challenge you to let kids grapple with problems. I know that, as teachers, it’s our nature to nurture. But kids can’t learn to solve problems if we always give them the answers. You might be surprised at the solutions they come up with!
Take a look at this Sharing Cookies problem.

If you had to guess, what grade level would you say this problem was designed for? Second grade? Third?
I have actually used the Sharing Cookies problem in both Kinder and 1st-grade classrooms. Let’s take a peek at what it sounded and looked like.
You can grab a copy of the Sharing Cookies problem as well as a couple of others using the link at the end of this post.
Solving the Problem
We start with a choral reading, one sentence at a time. Next, we modeled it using students volunteers. Here’s how it sounds:
Teacher: It says Suzy gave her 3 friends 5 cookies each. Hmmm. I need a friend to come up and help me (chooses a student to come up). This is my first friend. Friend, use your fingers to show me how many cookies you have (student holds up 5 fingers). Right, you got 5 cookies. Leave that hand up! Now I need another friend (chooses a second student to come up). This is my second friend. Show me how many cookies you got (student holds up 5 fingers). Great. Let’s see, how many cookies has Suzy given out so far? (Teacher holds her hands over each of the two students while the class counts 5, 10) So I’m done, right??
Students: NO!!! You need another friend.
Teacher: Oh, right (chooses another student to come up). Show me how many cookies you have (student holds up 5 fingers–repeat counting by fives). Hmmm, let’s see. The problem asks how many cookies Suzy has left (the teacher stands beside the 3 friends). Okay, I am Suzy. Turn and talk to your partner and see if you can figure out how many cookies I have left.
Lots of great math conversations! I see them looking at the fingers the friends are holding up (their arms are getting tired!) and looking back at the numbers in the problem. When I asked for their ideas, I got lots of different (wrong) answers, and that’s okay! A couple of students said 20, and I reminded them that Suzy only had 18 cookies to start with. And, yes, one pair of students came up with 3! They were so proud when they explained how they got their answer, and the other kids gave them their complete attention.
After we modeled with bodies, we modeled the same problem with two-color counters. Even though we had just done it with bodies, some of the kiddos still had a little bit of difficulty. But you know what, that’s why they call it problem-solving!!
Finally, we put our work on paper. I told them that mathematicians usually like to show their work at least two different ways. I suggested we draw a diagram first. You can see in the picture below how it turned out. I will tell you that they did most of the work on this poster. I asked how we could show the 18 cookies, and they suggested 18 circles. I had them turn and talk to a partner about how to show the cookies each friend got, and they suggested I circle 5 cookies. I circled the first group of 5, but I had helpers do the other two. Notice that we made a key to show that each circle represented one cookie. Finally, we did a tally mark chart.

Now I’m wondering, did you catch that Kinder and 1st-grade babies solved a division problem where they had to interpret the remainder? To me, that’s the amazing thing about great, rich problems and utilizing problem-solving strategies–kids can actually solve problems way beyond their actual skill set. A great diagram goes a long way!
Just a reminder here about CRA . Notice that we solved this problem using concrete and representational methods. No abstract here, because that wouldn’t be appropriate for these kiddos. The abstract would mean writing a division number sentence, and that would be meaningless to them. Now, if it had been an addition or subtraction problem, we would have written a number sentence and taken it through all stages of CRA.
Encouraging Multiple Representations
In order to be able to engage in productive struggle, students need tools. Otherwise, the struggle is not likely to be productive at all—just frustrating.
Prior to working on the Sharing Cookies problem, we discussed all the different ways mathematicians show their work, using the anchor chart shown below. The picture chart doesn’t really show it, but for the model , I actually glued counters on the poster. We talked about that when we use models, it’s things we can touch. Models also include acting out problems. You’ll notice on the anchor chart, all the different types of representations show the same thing—three friends with 2 cookies each. The students totally got that, and it was really cool.

Students should be able to use the representations that make sense to them. Of course, we teach lessons to introduce them to each of the representations, but then they become tools in their problem-solving toolboxes.
So there you have it. Go forth and let those students struggle!! Click here to grab your copy of the Sharing Cookies problem as well as a couple of others.

Similar Posts

Visualizing Fractions | EQUIVALENT FRACTIONS FREEBIE
How important is it that our students understand fractions? According to a study conducted by Carnegie Mellon University, it’s super important. The research team found that fifth graders’ understanding of…

Fact Practice Your Students Will Love!
Kids are competitive. Heck, adults are competitive. Add a little competition to your fact practice activities and you’re sure to have a hit on your hands. I call this game…


Another Look at 2-Digit Numbers
A couple of weeks ago, I blogged about working with my firsties on 2-digit numbers. This is a follow-up to that post. Let me reiterate that the idea of tens…

Flexibility with Place Value
Just a quick post about place value and how important it is for students to be able to decompose numbers by place value in different ways. Here’s what I mean….

Skip-Counting…It Ain’t Just 2s, 5s, and 10s!
Skip-counting is a skill that is often thought of as an activity for students in lower grades. It shows up in the CCSSM in a couple of places: K.CC.1–Count to 100…

Tackling Tough Math Word Problems
There’s no doubt that our students are seeing tougher word problems on state math accountability tests. In Texas, our students take the STAAR test, and the current version is much…
21 Comments
That is really interesting! I know I jump in too early. It is hard for me to see my kiddos struggle, but beyond that I start to doubt my instruction…”Maybe I didn’t teach this thoroughly enough”. “Maybe they’re not ready for this problem”. I also have a few criers in my room that tear up just thinking about thinking, which makes holding back even more difficult!
I’m going to keep in mind what you posted, and try it out for the remainder of the year!
Thanks again!
Halle Across the Hall in 2nd
I totally get your concerns, Halle! One way to approach it if they seem to hit the wall is through questioning. Instead of telling them exactly what to do try asking, “Could you use your counters to act out the story? What would this part of the story look like?”. It’s helping, but helping them to help themselves.
Great post Donna!!! I think my kids would benefit from doing it all three ways…that’s my note to self!!!! Have a good Wednesday! Amy Burton
Thanks, Amy! And you’re absolutely right–it’s good to work the same problem several different ways.
Thanks for the book title… I’m going to have to go grab it 🙂
Jessica Stanford Mrs. Stanford’s Class Blog My TpT Store
You’re welcome! You can actually read it online using that link, if you want to preview it before you buy it.
I try to let my kids grapple with problems. But what I find is they just shut down. I’m never sure if the problem is too hard or if I should just wait them out. Thanks for a great post. Barbara Grade ONEderful Ruby Slippers
Try guiding questions if a kiddo seems stuck. And make sure they have the tools they need to work the problem. Maybe they need manipulative or you could put it on their level by having them act it out. It may take time to see progress!
Acting them out is a good idea. I don’t do enough of that 🙂 Barbara Grade ONEderful Ruby Slippers
I couldn’t agree with you more! In fact, I extend it to problem solving with their peers. Thank you for the link to that book. Are there anymore from that same site you can suggest?
Love the problem solving chart. Will be part of math center.
Guilty! I am switching to the Guided Math model this year, instead of whole group work time and centers…I like the problem solving chart that shows different strategies, I will be more aware of my tolerance level towards struggling this year! Thanks Natalie
We’ve ALL been guilty! I think it’s just in our nature. I think you’ll love guided math.
I appreciate your blogs,Thanks for sharing!
Thank you Donna, for writing this entry and emphasizing the need for struggle-time. I realized that I was not allowing my kids much struggle-time during guided math after a CCSS seminar. I was too ready to get in there, and ‘help’.
Changing my outlook on struggle-time allowed my kids to savor sweet victory after they persevered; and it took some of the pressure off me as a teacher–I didn’t feel I needed to rush to the aid of the four different students who were struggling. I appreciate your blog so much.
The concept of struggle is so, so important!! It’s in our nature to jump in, so it takes a lot of self-discipline to give students that wait time.
Jumping in to the discussion 3 years later, but I just read a really good book called Number Sense Routines by Jessica Shumway in which the first suggested comment to a struggling child is, “What part do you understand so far?” I like that question a lot.
Never too late to enter the discussion! I love Jessica Shumway’s book, and I had forgotten about that question. Love it!!
So simple of an idea, yet I have seemed to make it harder! Learning here, learning!
I am also jumping into this discussion a few years late. I teach kindergarten and sometimes I find I move too quickly in teaching word problems. I don’t spend enough time with students acting out the problems and instead present other strategies for solving too soon after introducing word problems. What are your thoughts on introducing the concept and the pacing of introducing new strategies?
It’s a year-long thing! I think you are absolutely correct that we often move too fast. The value of acting out and teaching visualization strategies can’t be overemphasized.
Leave a Reply Cancel reply
Your email address will not be published. Required fields are marked *

Tech ed from Teacher-authors
Teaching Kids to Use Tally Charts
Teaching kids to use tally charts: fun and educational activities.
As parents and educators, we are constantly on the lookout for creative and engaging ways to teach children important skills. One such skill is the ability to use tally charts, which are a simple and effective way to collect and organize data. Tally charts are not only a fundamental part of mathematics and statistics, but they also play a crucial role in helping children develop their analytical and observational skills. In this blog post, we will explore various fun and educational activities that can help you teach kids how to use tally charts effectively.
What Are Tally Charts?
Before we dive into the activities, let’s briefly explain what tally charts are. Tally charts are a way to represent and count data quickly and efficiently. They consist of a series of vertical lines, or strokes, with every fifth line drawn diagonally to make counting easier. Each group of five strokes represents a specific quantity, such as five, ten, or fifteen.
Tally charts are commonly used to collect and display data in a simple and visual format. They are especially useful when you want to count the occurrences of different items or events and compare the quantities. Tally charts are widely used in various fields, including science, sports, and business, making them an essential skill for children to learn.
Fun Tally Chart Activities for Kids
- Counting Objects : Start with a hands-on activity where children count objects and create charts to represent their counts. For example, gather a basket of different colored balls and have your child count how many of each color there are. They can then create a chart to record the counts for each color.
- Nature Walk Tally : Take your kids on a nature walk and ask them to tally different things they observe, such as birds, trees, flowers, or insects. This activity not only introduces tally charts but also encourages children to connect with the natural world.
- Favorite Ice Cream Flavors : Create a chart to find out everyone’s favorite ice cream flavor in your family. Each family member can vote for their preferred flavor, and the children can record the votes using marks. This activity not only teaches charts but also involves a fun ice cream tasting session!
- Tallying Daily Activities : Have your child keep track of their daily activities using charts. For example, they can tally the number of times they read, play video games, go outside, or eat fruits and vegetables. This activity helps them understand how data collection can be a part of their daily routines.
- Sports Score Tally : If your child is interested in sports, you can use graphs to keep score during a game. For instance, while watching a baseball or basketball game, they can tally the number of points each team scores. This real-life application of tally charts can make learning more engaging.
- Weather Tally : Create a weather chart where your child records the daily weather conditions, such as sunny, cloudy, rainy, or snowy. They can use marks to keep track of how many days each type of weather occurs. Over time, they can analyze the data and make observations about the weather in your area.
- Graphing Tally Data : Once your child has gathered data using charts, introduce them to graphing. Help them create bar graphs or pictographs based on their tally data. This step reinforces the connection between graphs and other forms of data representation.
- Tallying in the Kitchen : Involve your child in cooking or baking activities, and have them use tally charts to keep track of ingredients. For instance, when making cookies, they can tally the number of cups of flour, sugar, and chocolate chips used. This not only teaches tallying but also reinforces measurement skills.
- Chart Art : Encourage your child to get creative with charts by turning them into art projects. They can create colorful tally graphs and use them to represent their favorite animals, fruits, or cartoon characters.
- Challenge : Organize a challenge where your child competes with their friends or siblings to see who can tally the most items accurately in a set amount of time. This friendly competition adds an element of excitement to learning tally charts.
Benefits of Teaching Tally Charts
Teaching kids to use charts through these fun and educational activities offers several benefits:
1. Improved Counting Skills
Tally chart templates reinforce counting skills as children practice counting by ones and fives. You can try it now and see how it helps them become more proficient in basic arithmetic.
2. Enhanced Observation Skills
Creating charts requires careful observation. Kids learn to pay attention to details and gather data accurately, which is a valuable skill in various aspects of life.
3. Data Interpretation
As children collect and analyze data using charts, they develop the ability to draw conclusions and make simple predictions based on the data they have collected.
4. Real-Life Application
Many of the activities mentioned involve tallying real-world data, making the concept of tally charts more tangible and relatable for children.
5. Creativity and Engagement
Turning tally charts into art or participating in challenges adds an element of creativity and excitement to learning, keeping children engaged and motivated.
6. Foundation for Data Literacy
Understanding charts lays the groundwork for more advanced data literacy skills, such as creating and interpreting bar graphs, histograms, and scatterplots.
In conclusion, teaching kids to use tally charts through engaging and interactive activities is a wonderful way to foster their mathematical skills and cultivate a love for data analysis. By involving children in real-life situations, such as nature walks, family polls, and kitchen adventures, we can seamlessly integrate charts into their daily lives, making the learning process enjoyable and practical.
These activities not only introduce children to the concept of charts but also equip them with essential life skills. They learn to count accurately, observe details keenly, and draw conclusions based on data—skills that are valuable in various academic subjects and future careers. Moreover, as they progress in their education, they will find that charts serve as a fundamental building block for more complex data representations and statistical analyses.
–image credit Deposit Photo
Copyright ©2023 askatechteacher.com – All rights reserved.
Here’s the sign-up link if the image above doesn’t work:
https://forms.aweber.com/form/07/1910174607.htm
Jacqui Murray has been teaching K-18 technology for 30 years. She is the editor/author of over a hundred tech ed resources including a K-12 technology curriculum , K-8 keyboard curriculum, K-8 Digital Citizenship curriculum . She is an adjunct professor in tech ed, Master Teacher, webmaster for four blogs, an Amazon Vine Voice , CSTA presentation reviewer, freelance journalist on tech ed topics, contributor to NEA Today , and author of the tech thrillers, To Hunt a Sub and Twenty-four Days . You can find her resources at Structured Learning.
Share this:
- Click to share on Facebook (Opens in new window)
- Click to share on Twitter (Opens in new window)
- Click to share on LinkedIn (Opens in new window)
- Click to share on Pinterest (Opens in new window)
- Click to share on Telegram (Opens in new window)
- Click to email a link to a friend (Opens in new window)
- Click to print (Opens in new window)
- Click to share on Pocket (Opens in new window)
- Click to share on Tumblr (Opens in new window)
- Click to share on Reddit (Opens in new window)
- Click to share on WhatsApp (Opens in new window)
Related Articles

2 thoughts on “ Teaching Kids to Use Tally Charts ”
This article on teaching kids to use tally charts is a valuable resource for parents and educators alike. The emphasis on introducing a fundamental and visual method like tally charts is crucial in building a solid foundation for children’s understanding of data representation.
The step-by-step approach outlined in the article is commendable, breaking down the concept into manageable stages. The inclusion of practical examples and interactive activities makes the learning process engaging for young minds. It’s evident that the article is designed with the child’s perspective in mind, making it accessible and enjoyable.
Tally charts are not only a practical tool for counting but also serve as a gateway for kids to grasp more complex concepts in data analysis later on. This foundational knowledge can set the stage for a deeper understanding of mathematics and statistics as they progress through their education. https://www.ourgreenstreets.org/org/asda-holt-park-recycling-site/
Couldn’t agree more, George. That visual approach is often the only effective one for many kids.
Comments are closed.
We are a group of dedicated technology teachers with tons of experience in teaching K-18 t ech, unraveling its problems, and making it exciting for kids (and adults). We blog here, teach online grad school classes, provide curricula (like K-12 Technology curriculum , K-8 keyboard curriculum, K-8 Digital Citizenship curriculum ). Jacqui Murray (the face of AATT) also authors tech thrillers, To Hunt a Sub and Twenty-four Days . You can find our resources at Structured Learning.

Subscribe to Blog via Email
Enter your email address to subscribe to this blog and receive notifications of new posts by email.
Email Address
Find Us, Follow Us

Top Posts & Pages

Fun Typing Games

Emails/Newsletters
One-time donation, monthly donation, aatt resources.
This slideshow requires JavaScript.
Find books here…

Student Workbooks

Homeschoolers

Teaching Strategies
- Digital Literacy 0
- Flipped Class 0
- Frayer Model 0
- Habits of Mind 0
- Mindfulness 0
- Orton-Gillingham 0
- 7 Assessment Tools
- Benchmark assessments
- CC Assessments
- Common Core and Assessment
- Report Cards and Tech
- 13 Skills that Blogs Teach
- 3 Issues before schools blog
- Blogging and CC
Book Reviews
- CC Literacy
- CC Meets GA
- Endangered Minds
Chromebooks
- Chromebooks in Class
- Chromebooks–Pros/Cons
Common Core
- Adapt to CC
- Align Tech with CC
- CC and Blogs
- CC and keyboarding
- CC and publishing
- CC Classroom
Digital Citizenship
- 17 DigCit Topics
- 1st Grade DigCit
- 2nd Grade DigCit
- 3rd Grade DigCit
- 4th Grade DigCit
- 5th Grade DigCit
- 6th Grade DigCit
- Kindergarten DigCit
- Charts in Excel
- Excel and Arrays
- Shapes in Excel
- Tessellations in Excel
Featured Articles
- Are you a new tech teacher?
- Computers and Tech Teachers
- Create an inquiry-based class
- Twitter in Education
- You're a Geek now
- Create wallpaper
- 5 Favorite Apps
- IPads vs. laptops
Keyboarding
- 6 Ways to Make KB Fun
- Adults and keyboarding
- Do we need KBing?
- Handwriting vs. KB
- Is KB Cool?
- KB class in 25 minutes
- KB with ASCII art
Online classes
- Work remotely
Presentations
- 15-second presentation
- PowerPoint or Publisher
Problem solving
- 3-click rule
- Computer quits
- I Can Solve That
- Most common problems
- What if Computers Fail
- What if Tech Fails
Miscellaneous
- Structured Learning 0
Special Needs
- Special Needs–Reading
- Tech and Special Needs
- Entries feed
- Comments feed
- WordPress.org

Question? Click…

Any cookies on my website are used to ensure normal website functions (for instance, Youtube videos won’t work without their own identifiers). These cookies cannot be switched off because the website wouldn’t work properly anymore. However, these identifiers do not store any personal data.

Legal stuff
When you leave a comment, WordPress stores your gravatar name, IP Address, comment, and email address. Therefore, leaving a comment is considered a clear affirmative, specific, and unambiguous action as defined by the GDPR giving me consent to store this information, and permission to contact you in the future by email.
Your personal information will not be sold or shared with any third parties under any circumstances. Your information shall be retained until you unsubscribe or ask me to remove your data. If you feel your data has been misused, you have a right to complain to the Hellenic Data Protection Authority (HDPA). If you do not consent to the above, please don’t leave a comment.
AI Legal Notices
The content presented in this blog is the result of my creative imagination and not intended for use, reproduction, or incorporation into any artificial intelligence training or machine learning systems without prior written consent from the author.”
Copyright © 2024

Or search by topic
Number and algebra
- The Number System and Place Value
- Calculations and Numerical Methods
- Fractions, Decimals, Percentages, Ratio and Proportion
- Properties of Numbers
- Patterns, Sequences and Structure
- Algebraic expressions, equations and formulae
- Coordinates, Functions and Graphs
Geometry and measure
- Angles, Polygons, and Geometrical Proof
- 3D Geometry, Shape and Space
- Measuring and calculating with units
- Transformations and constructions
- Pythagoras and Trigonometry
- Vectors and Matrices
Probability and statistics
- Handling, Processing and Representing Data
- Probability
Working mathematically
- Thinking mathematically
- Mathematical mindsets
- Cross-curricular contexts
- Physical and digital manipulatives
For younger learners
- Early Years Foundation Stage
Advanced mathematics
- Decision Mathematics and Combinatorics
- Advanced Probability and Statistics
Resources tagged with: Frequency tables and bar charts
There are 16 NRICH Mathematical resources connected to Frequency tables and bar charts , you may find related items under Handling, processing and representing data .
Sticky Data
You'll need to work in a group on this problem. Use your sticky notes to show the answer to questions such as 'how many girls are there in your group?'.
Have a look at this data from the RSPB 2011 Birdwatch. What can you say about the data?
Class 5's Names
Class 5 were looking at the first letter of each of their names. They created different charts to show this information. Can you work out which member of the class was away on that day?
Who's the Best?
Which countries have the most naturally athletic populations?
Substitution Cipher
Find the frequency distribution for ordinary English, and use it to help you crack the code.
Real Statistics
Have a look at this table of how children travel to school. How does it compare with children in your class?
How Big Are Classes 5, 6 and 7?
Use the two sets of data to find out how many children there are in Classes 5, 6 and 7.

Growing Families
What do these statistics about family size mean?
A Population Survey
A geographical survey: answer the tiny questionnaire and then analyse all the collected responses...
Challenging Data Tasks: The Making of "Where Are You Flying?"
How was the data for this problem compiled? A guided tour through the process.
Where Are You Flying?
Where do people fly to from London? What is good and bad about these representations?
It's a Scrabble
Letters have different values in Scrabble - how are they decided upon? And would the values be the same for other languages?
Data Matching
Use your skill and judgement to match the sets of random data.
Presenting the Project
Have a look at all the information Class 5 have collected about themselves. Can you find out whose birthday it is today?
What Does it Say to You?
Written for teachers, this article discusses mathematical representations and takes, in the second part of the article, examples of reception children's own representations.
The Pet Graph
Tim's class collected data about all their pets. Can you put the animal names under each column in the block graph using the information?

Reading & Math for K-5
- Kindergarten
- Learning numbers
- Comparing numbers
- Place Value
- Roman numerals
- Subtraction
- Multiplication
- Order of operations
- Drills & practice
- Measurement
- Factoring & prime factors
- Proportions
- Shape & geometry
- Data & graphing
- Word problems
- Children's stories
- Leveled Stories
- Context clues
- Cause & effect
- Compare & contrast
- Fact vs. fiction
- Fact vs. opinion
- Main idea & details
- Story elements
- Conclusions & inferences
- Sounds & phonics
- Words & vocabulary
- Reading comprehension
- Early writing
- Numbers & counting
- Simple math
- Social skills
- Other activities
- Dolch sight words
- Fry sight words
- Multiple meaning words
- Prefixes & suffixes
- Vocabulary cards
- Other parts of speech
- Punctuation
- Capitalization
- Narrative writing
- Opinion writing
- Informative writing
- Cursive alphabet
- Cursive letters
- Cursive letter joins
- Cursive words
- Cursive sentences
- Cursive passages
- Grammar & Writing
Breadcrumbs
- Data & Graphing
- Tally Sheets

Download & Print Only $2.50
Counting with tally sheets
4 groups of tallies.
Students count items into 4 groups using tallies in these data worksheets. Sorting, counting and tallies are all skills which can best be practices with real life objects around the household.

Art materials:
Christmas balls:
Summer clothing:
Sea animals:

These worksheets are available to members only.
Join K5 to save time, skip ads and access more content. Learn More
What is K5?
K5 Learning offers free worksheets , flashcards and inexpensive workbooks for kids in kindergarten to grade 5. Become a member to access additional content and skip ads.
Our members helped us give away millions of worksheets last year.
We provide free educational materials to parents and teachers in over 100 countries. If you can, please consider purchasing a membership ($24/year) to support our efforts.
Members skip ads and access exclusive features.
Learn about member benefits
This content is available to members only.
- Forgot Password?

IMAGES
VIDEO
COMMENTS
How to draw a tally chart. In order to draw a tally chart, you need to: Draw a data table with. 3. \textbf {3} 3 columns. Write the category names into each row of the table. Record the data into the table using five-bar gate tally marks. Work out the frequency for each category by counting the tally marks.
How to draw a tally chart. In order to draw a tally chart: Draw a data table with. 3. \bf {3} 3 columns. Write the category names into each row of the table. Record the data into the table using five-bar gate tally marks. Work out the frequency for each category by counting the tally marks.
Tally Chart Worksheets. There are several different skills involved in using and understanding tally charts which our worksheets cover: converting a tally into a number; recording numbers as a tally; counting different data items and recording them correctly in a tally. These sheets are aimed at kids in 1st and 2nd grade.
The tally chart is read by multiplying the bundles of tallies by 5 and adding the individual tallies to obtain the frequency of each value or category. As an example, the following is a tally chart of the heights (in cm) of 300 individuals. We want to determine the frequency of each height. Height. Tally.
To represent and interpret data, first collect data and then show it visually - in a table or on a graph. This is representing data. Interpreting data is using data analysis to answer questions. One easy way to collect and represent data is with a tally chart. To do this, sort the data into categories and use tally marks to show the frequencies.
A tally chart is a method to present information where the data is recorded using different sets of vertical dashes. A single dash signifies the counting of a single item. Every time an object is observed or counted a dash is drawn next to the previous dash till the number of dashes reaches four. When the counted number of items crosses five ...
Reasoning and Problem Solving - Make Tally Charts - Year 2 Expected. 7a.Class 5 have started a tally chart for the after school clubs they attend. 5 more children go to Chess than Choir. 8 fewer children go to Coding than Chess. 11 fewer children go to Netball than Coding and Choir added together. Clubs Tally Total.
A tally chart is a table used for counting and comparing the numbers of multiple classes of a data set. Tally charts are used to collect data quickly and efficiently, since filling a chart with marks is much speedier than writing words. The format also lends itself nicely to collecting data in subgroups, which can be useful.
Tallying is a way of recording data that counts in groups of five. The data is tallied as it is counted, with a mark for each piece of data, and then the frequency is recorded at the end. Tally ...
Lesson: Tally Charts Mathematics • 2nd Grade. Lesson: Tally Charts. Start Practising. In this lesson, we will learn how to read a tally chart to solve simple put-together, take-apart, and compare problems.
The tally mark is a math tool that comes in handy throughout life. It is easy to use, and easy to read. Teaching about tally charts is a great way to introduce graphs and data to first graders. These resources on how to create and read a tally chart are perfect for helping young students develop an appreciation for data one tally mark at a time.
When the data is represented in a table form with tally marks, that table is known as a tally mark chart. A tally mark chart helps to give a clear view of data. Tally marks on the chart are the easiest way of keeping track of numbers in groups of five. ... Become a problem-solving champ using logic, not rules. Learn the why behind math with our ...
This Year 2 Make Tally Charts lesson covers the prior learning of counting in 5s, before moving onto the main skill of recording data using tally charts. ... powerpoint can be used to model the questions that the children will complete on the Varied Fluency and Reasoning & Problem Solving worksheets as part of this lesson. Download PowerPoint.
These mastery activity cards develop fluency, reasoning and problem solving when supporting the year 2 White Rose Maths small step 'Make Tally Charts'. These mastery activity cards support the White Rose Maths small step 'Make Tally Charts' and are a great way to develop children's skills at drawing and interpreting tally marks and charts.
Problem Solving Abilities Students will enhance their problem-solving abilities by interpreting tally chart information to answer the problems. They will gain experience in seeking relevant information, making accurate interpretations and coming up with accurate answers — an important skill not only acadically, but also in day-to-day life ...
Watch practice pivot toward ungrouped discrete data in this resource on tally marks word problems for grade 2 and grade 3. Read the data, group them by drawing the appropriate number of lines, and answer the questions. Access our printable tally marks word problems worksheets to test and further your skills while applying the tally marks in ...
Finally, we did a tally mark chart. Now I'm wondering, did you catch that Kinder and 1st-grade babies solved a division problem where they had to interpret the remainder? To me, that's the amazing thing about great, rich problems and utilizing problem-solving strategies-kids can actually solve problems way beyond their actual skill set.
Benefits of Teaching Tally Charts. Teaching kids to use charts through these fun and educational activities offers several benefits: 1. Improved Counting Skills. Tally chart templates reinforce counting skills as children practice counting by ones and fives. You can try it now and see how it helps them become more proficient in basic arithmetic. 2.
TEC 5970/INT 5970 Problem Solving. Problem-solving Tool VII: Tally Chart and Histogram ... One of the ways to describe the process variation is to use tally chart and then configure a histogram. Tally chart is a chart or a table that counts all the occurrences at each data value or each cell. The following table presents 125 observations on the ...
Resources tagged with: Frequency tables and bar charts Types All types Problems Articles Games Age range All ages 5 to 11 7 to 14 11 to 16 14 to 18 Challenge level There are 16 NRICH Mathematical resources connected to Frequency tables and bar charts , you may find related items under Handling, processing and representing data .
IXL's SmartScore is a dynamic measure of progress towards mastery, rather than a percentage grade. It tracks your skill level as you tackle progressively more difficult questions. Consistently answer questions correctly to reach excellence (90), or conquer the Challenge Zone to achieve mastery (100)! Learn more. 0.
Make tally charts | Mastery Cards. Year: 2. Pages: 1. Answers: Yes. Problem solving and reasoning cards allowing children to solve complex problems in various contexts for making tally charts. Photos. Curriculum Links.
4 groups of tallies. Students count items into 4 groups using tallies in these data worksheets. Sorting, counting and tallies are all skills which can best be practices with real life objects around the household. Stickers: Worksheet #1. Art materials: Worksheet #2. Christmas balls: Worksheet #3.