

Configure SSRS with an SSL Certificate
Thomas Liddle , 2017-03-02
SQL Server Reporting Services is becoming increasing popular to produce reports with data from SQL Server or Analysis Services. Keeping that data secure in an internal or external environment is a must. In this article, we will walk though how to configure SQL Server Reporting Services 2016 and enable SSL with a self-signing certificate.
Prerequisites
You will need the following to configure SSL on SQL Server Reporting Services
- SQL Server Reporting Services Native Mode and SQL Server Database Engine 2016 installed
- Trusted or Self-Signing Certificate (Instructions for Self-Signing Certificates are below)
Generate a Self-Signing Certificate with Powershell
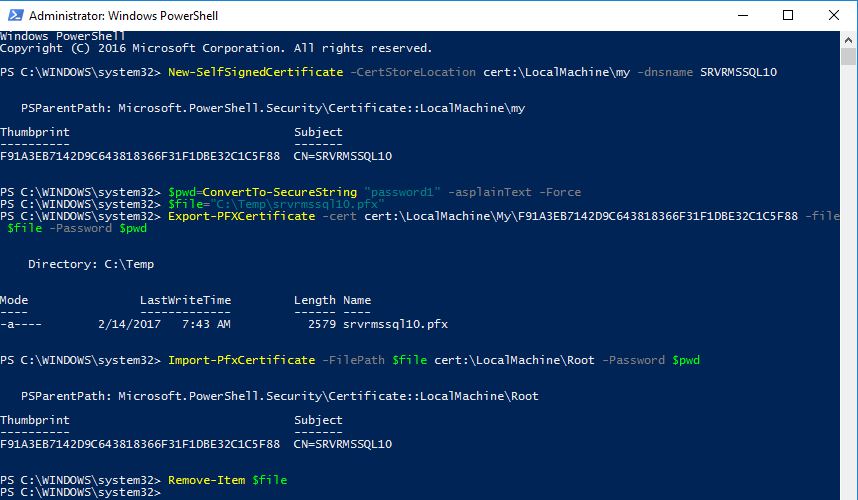
To setup SSL for SQL Server Reporting Services 2016 we will need to generate a certificate. If you already have a certificate from a trusted authority, you can skip this step. For our demostrations, we will gernerate a self-signing certificate and import it into our Trusted Root.
- Open Powershell as Administrator
- Run the following commands
Configure Web Service URL
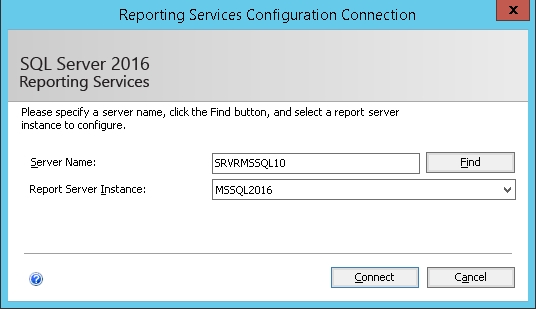
- Open Reporting Services Configuration Manager
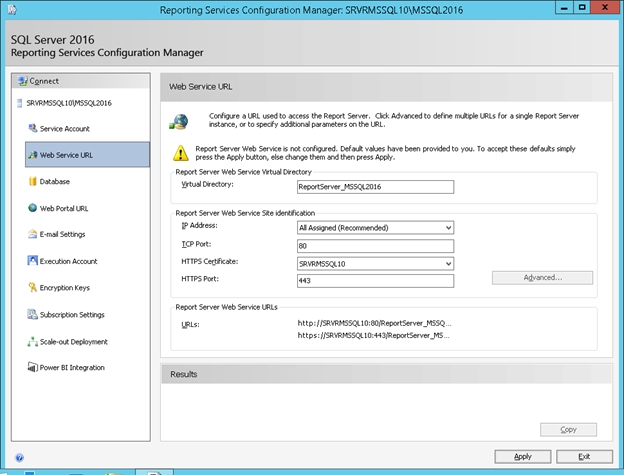
- Click on Web Site URL in the left-hand pane window
- In the “HTTPS Certificate” drop-down box select the certificate you installed. You will see the Port text box pre-fill and the Report Server Web Services URL pre-fill.
Configuring a Database for SQL Server Reporting Services
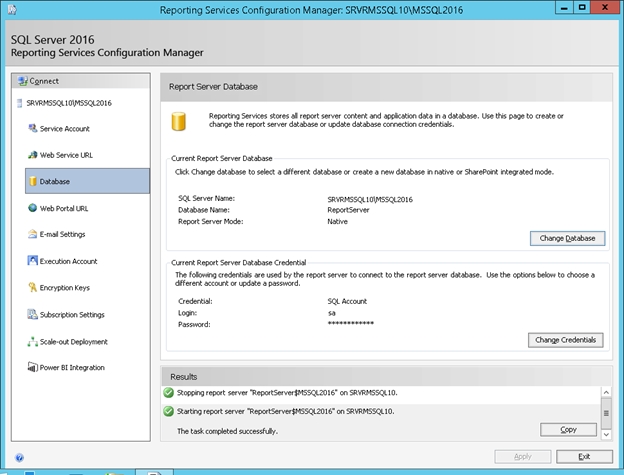
- Click on Database in the left-hand pane window
- Click Change Database
- In the “Report Server Database Configuration Wizard” click Create a New Report Server Database
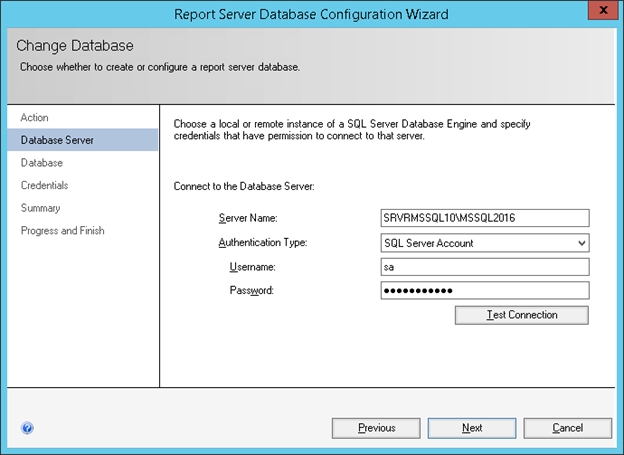
- Type in the Server Name and Authenticate Type for the connection of SQL Server Reporting Services to the database. You have two options “SQL Server Account” or “Current User”. This step is NOT the service account that will be running the SSRS services. It is only used to create the database for SSRS.
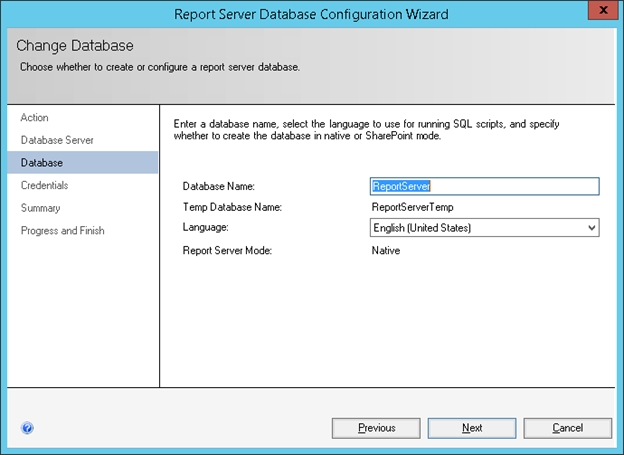
- Click Next at the Summary Page
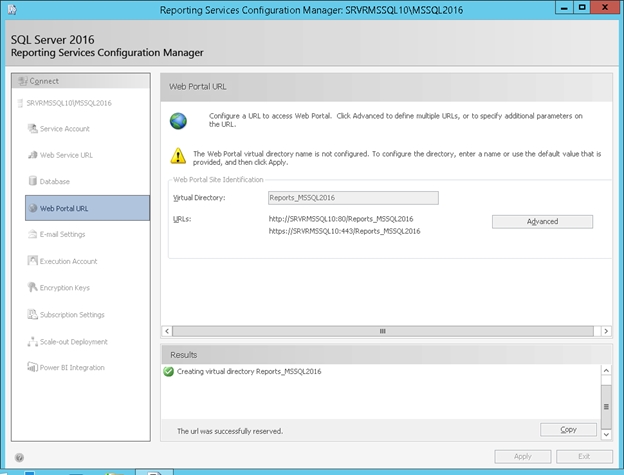
Configure the Web Portal URL
- Click the Web Portal URL , in the Reporting Services Configuration Manager
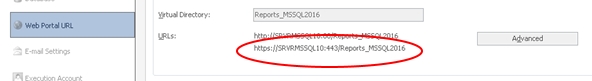
Testing your New Secure URL
Secure SSRS Web Site
Log in or register to rate
You rated this post out of 5. Change rating
- Reporting Services (SSRS)
Join the discussion and add your comment
Related content
Extending sql server reporting services with sql clr table-valued functions.
- by Additional Articles
- TechNet Blogs
This article describes how to take advantage of SQL CLR table-valued functions to combine different types of data sources to create rich and exciting SQL Server Reporting Services reports.
2,625 reads
Developing Report Navigation and Drilldown
This article presents an excerpt from the book, Microsoft SQL Server 2005 Reporting Services for Dummies, by Mark Robinson. Learn how to produce interesting navigation and drill down reporting using the basic tools provided within SQL Server 2005 Reporting Services.
2,216 reads
Building Custom Reporting Services Reports for SQL Server Management Studio
- Database Journal
Learn how to build Custom Reports, without installing Reporting Services, using a new feature found in Microsoft Service Pack 2 (SP2) for SQL Server 2005.
4,068 reads

Using Report Parameters in SQL Server Reporting Services
- SQL Server Performance
Report parameters assist in narrowing down a report for better analysis.
2,614 reads
Navigation Options in Reports
- by Vasant Raj
- SQLServerCentral.com
You can build some very complex reports in Reporting Services and longtime author Raj Vasant brings us a short tutorial on how you can implement internal navigation structures in your reports.
5,171 reads
How to setup a SSL certificate with SQL Reporting Services ( HTTPS for SSRS )
This article applies to the following products:
- Messageware Exchange Protocol Guard 2019
- Messageware Exchange Protocol Guard 2016
- Messageware Exchange Protocol Guard 2013
- Messageware OWA Guard 2016
- Messageware OWA Guard 2013
- Messageware OWA Guard 2010
EPG Reports rely on SQL Reporting Services that by default are using port 80 for communication with the database. The article presents a way to enable more secure way of communication using encrypted traffic using HTTPS port 443.
The article has been based on the article: https://support.sectigo.com/IS_KnowledgeDetailPage?Id=kA03l000000vFwq
If no Certificate Authority is installed in the domain, we will have to generate a Self-Signed to be able to use it to encrypt the traffic
On the SQL server, please perform the steps below to generate a Self-Signed certificate and install it to both Personal Store and Trusted Root Certifications authorities
- The scripts uses a path "c:\Temp" . Please confirm that Temp folder exists on the C drive before proceeding to step 2.
- New-SelfSignedCertificate -CertStoreLocation cert:\LocalMachine\my -dnsname SQLHOSTNAME -NotAfter (Get-Date).AddMonths(60) (please replace the SQLHOSTNAME with an actual Hostname of your SQL Server)
- $pwd=ConvertTo-SecureString " password " -asplainText -force (please replace the password with a more complicated string)
- $file="C:\temp\SQLcertificate.pfx" (the location where the certificate will be exported)
- Export-PFXCertificate -cert cert:\LocalMachine\My\<Thumbprint produced during first command> -file $file -Password $pwd (Export the certificate to a file)
- Import-PfxCertificate -FilePath $file cert:\LocalMachine\root -Password $pwd (the command imports the generated certificate into the Trusted Root Certification Authorities store)
- On the SQL Server open the Report Server Configuration Manager
- Switch to Web Service URL
- Click “Advanced” and click Add under HTTPS on the bottom of the window
- Choose the certificate from the list and Click OK
- The Reporting Service are now configured to use both HTTP and HTTPS traffic.
- Optionally - For better security the HTTP protocol can be removed from the list, leaving only HTTPS as active.
(Optional step – removing HTTP port)
- Copy the file generated in the first step – in the above example the file is saved under C:\temp\SQLcertificate.pfx – to the Server where the EPG Web Management is installed
- On the destination Server double click on the file and in the first window choose “Local Machine”
- When asked for a password, provide the password that was set in step 1.1 above
- On the next screen select “Place all certificates in the following store” , click Browse and select “Trusted Root Certification Authorities” from the list and click OK .
- Click Next and Finish the installation
- Open EPG-Reports URL
- Switch to Settings tab
- Replace the Reporting Services URL with the new URL starting with HTTPS://
- Press Save on the top of the page
This browser is no longer supported.
Upgrade to Microsoft Edge to take advantage of the latest features, security updates, and technical support.
What is SQL Server Reporting Services (SSRS)?
- 14 contributors
Applies to: ✅ SQL Server 2016 (13.x) Reporting Services and later ❌ Power BI Report Server
SQL Server Reporting Services (SSRS) provides a set of on-premises tools and services that create, deploy, and manage paginated reports. Download SQL Server 2022 Reporting Services from the Microsoft Download Center.

Looking for Power BI Report Server? See What is Power BI Report Server?
Create, deploy, and manage reports
The SSRS solution flexibly delivers the right information to the right users. Users can consume the reports in a web browser on their computer or mobile device, or via email.
SQL Server Reporting Services offers an updated suite of products:
- Paginated reports brought up to date, so you can create modern-looking reports, with updated tools and new features for creating them.
- A modern web portal you can view in any modern browser. In the new portal, you can organize and display paginated Reporting Services reports and KPIs. You can also store Excel workbooks on the portal.
- New mobile reports with a responsive layout that adapts to different devices and the different ways you hold them.
Read on for more about each.
What's new in Reporting Services
See What's new in Reporting Services to keep up to date on new features in SQL Server Reporting Services.
Paginated reports

Reporting Services is associated with paginated reports, ideal for fixed-layout documents optimized for printing, such as PDF and Word files.
That core BI workload still exists today, so we've modernized it. Now you can create modern-looking reports with updated new features, using Report Builder, or Report Designer in SQL Server Data Tools (SSDT) .
- We updated all the default styles and color palettes, so by default you create reports with a new minimalist modern style.
- We updated the Parameter pane, so you can arrange parameters however you want.
- You can export to new formats such as PowerPoint. Reporting Services visualizations in PowerPoint are live and editable, not just screenshots.
- You can create a hybrid Power BI/Reporting Services experience: Rather than recreating your on-premises Reporting Services reports in Power BI, you can pin visuals from those reports to your Power BI dashboards. Then you can monitor everything in one place on your Power BI dashboard.
- Mobile reports

Mobile computing has shifted the devices we need to work, meaning people today have a different reporting need. The fixed-layout report experience doesn't work well when you introduce tablets and phones. Something designed for a wide PC screen isn't the optimal experience on a small phone screen that's not just smaller but a portrait or landscape orientation.
What you need with these widely different screen form factors is a responsive layout that adapts to these different screen sizes and orientations. For that we've added a new report type: mobile reports, based on the Datazen technology we acquired about a year ago and integrated into the product. You can migrate your existing Datazen reports to Reporting Services with the SQL Server Migration Assistant for Datazen .
You create these mobile reports in the new Mobile Report Publisher app. Then in the native Power BI apps for mobile devices for Windows, iOS, Android, and HTML5, you can access the data you have in Power BI, the cloud, or SSRS.
As you create visualizations, Mobile Report Publisher automatically generates sample data. This feature allows you to see how the visualization will look with your data, and what kind of data works well in each visualization.

For end users of Reporting Services, the front door is a modern web portal you can view in most browsers. You can access all your Reporting Services reports and KPIs in the new portal. KPIs can surface key business metrics at a glance in the browser, without having to open a report.
The new web portal is a complete rewrite of Report Manager. Now it's a single-page, standards-based HTML5 app, which modern browsers are optimized for: Microsoft Edge, Internet Explorer 10 and 11, Chrome, Firefox, Safari, and all the major browsers.
The content on the web portal is organized by type:
- paginated reports
- Excel workbooks
- shared datasets
- shared data sources
You can store and manage them securely here, in the traditional folder hierarchy. Tag your favorites reports for quick access. Those with appropriate permissions are able to manage and administer SSRS content.
And you can still schedule report processing, access reports on demand, and subscribe to published reports in the new web portal.
More about the Web portal .
Reporting Services in SharePoint integrated mode
You publish reports to Reporting Services in SharePoint integrated mode. You can schedule report processing, access reports on demand, subscribe to published reports, and export reports to other applications such as Microsoft Excel. Create data alerts on reports published to a SharePoint site and receive email messages when report data changes.
More about Reporting Services report server in SharePoint integrated mode .
Reporting Services programming features
Take advantage of Reporting Services programming features so you can extend and customize your reporting functionality. Use the SSRS APIs to integrate or extend data and report processing in custom applications.
More Reporting Services developer documentation .
Related content
Install Reporting Services
Download SQL Server Data Tools (SSDT)
Install Report Builder
More questions? Try asking the Reporting Services forum
Was this page helpful?
Coming soon: Throughout 2024 we will be phasing out GitHub Issues as the feedback mechanism for content and replacing it with a new feedback system. For more information see: https://aka.ms/ContentUserFeedback .
Submit and view feedback for
Additional resources
- Guides and Tutorials
- Setup and How-to Guides
- Secure Microsoft SSRS
Secure Microsoft’s SQL Server Reporting Services with SSL/TLS
Microsoft’s SQL Server Reporting Services is a popular Business Intelligence framework. Through SSRS, administrators can analyze, collate, and synthesize data from a variety of sources into easy to consume web-based reports. It is common for third-party software to rely on the rich underpinnings of SSRS for integration purposes, choosing to make SSRS reports available through its own interface.
Since data is used to make decisions, it is very important to protect privacy and prevent tampering over the network. Imagine a nosy employee intercepting salary data, or a bad actor manipulating a report in-flight in order to present altered data! This is why securing SSRS with SSL/TLS is so important – SSL/TLS provides both encryption and message integrity. Securing SSRS can be confusing at first however, with a couple of “gotchas” along the way.

Configuring SSRS
Adding an ssl/tls certificate.
It is recommended to configure SSRS BEFORE applying an SSL/TLS certificate.

By default, SSRS will create a “virtual service account”. For those familiar with Active Directory, this is somewhat similar to a localized version of a GMSA (Group-managed service account). This special local account doesn’t require you to set a password. In certain situations, it is preferable to use a domain account. In the case of third-party integration, often the account running the software also runs the SSRS instance!

On this screen, simply hit “Apply” to accept the defaults. We will come back in and replace this with an HTTPS connection later, but this will allow us to proceed through the rest of the setup.

Under “Database” we must create a database for our SSRS instance. Somewhat counterintuitively, select “Change Database”.

Select “Create a new report server database”. (Or, if this is an upgrade/migration, choose an existing report server database instead). Usually, SQL Server runs on the server running Reporting Services itself, but it is possible to configure it to point to another server.

If the user you are signed in as has sysadmin level privilege on your local SQL Server instance, simply select “Next”. This establishes a connection to the instance for configuration purposes, but the credentials chosen on this screen are NOT persistent. Don’t worry about SSRS running as your administrative user in perpetuity!

Select “Next” to create your Report Server database. Most of the time, your report server mode will be “Native”. The alternative is a Sharepoint-managed SSRS instance, which is installed as part of a Sharepoint deployment through a different tool.

On this screen, we specify the credentials SSRS will use going forward to connect to SQL Server. The default is to create an account for this purpose with least privilege. In most cases, this is the best choice.

On the summary screen, select “Next”. SSRS will begin its database configuration routine.

The wizard takes three to four minutes. When it completes, select “Finish”.

Select “Web Portal URL” and choose “Apply”.

Email settings are important to configure if you want to be able to email out reports on a schedule.

Execution Account allows you to specify a service principal in whose context certain operations to remote servers will run. Most of the time, we can leave this blank. In the cases it is required, it is usually called out in vendor documentation.

Take a backup of your encryption keys.

You will need to specify a password, which will be used to protect the symmetric key. Be sure to record this passphrase for safekeeping, this will be absolutely required during upgrades of SSRS.
Unless your vendor documentation says otherwise, “Subscription Settings”, “Scale-Out Deployment” and “Power BI Service” can usually be ignored. These constitute certain advanced features of SSRS.
Your SSL/TLS certificate must now be setup in two separate spots, which can be confusing at first. Since SSRS’s configuration tool will let you specify a certificate that is present in the machine store’s personal certificate node, first we must import a certificate to this location. Alternatively, we could create our CSR from the MMC on the SSRS Server (which stores the private key on this machine in the “Certificate Enrollment Requests” node), and subsequently import our signed response from our CA.
n.b. Ensure when creating your CSR to populate the SAN name field in the certificate, even if it is the same as the common name. This is required for browsers to trust your certificate!
Older versions of SSRS were notorious for being unable to work with wildcard certificates. More recent versions do not have this problem.
Under “Web Services URL”, select “Advanced”.

Choose “Add” on the bottom.

Choose a “Certificate”. Available options are sourced by enumerating anything in the machine store’s node. Ensure that you select a certificate with a corresponding private key! Anything in the personal node will appear, but a certificate without a private key is not a valid selection, and will result in cryptic errors.

Note that “URL” is sourced from the common name of the certificate.

Optionally, remove the HTTP Identity, and then select “OK”.

The above error is common in the case of using an internally signed CA. The underlying windows machine MUST trust the certificate chain of the certificate you select in order to create a binding for it. If needed, add relevant root and Intermediate Certificate into the appropriate machine certificate stores!

Once the configuration has been appropriately applied, the “apply” button will become greyed out.
Next, select “Web Portal URL”.

Select “Advanced”.

Once again, select the bottom “Add” button.

Choose your certificate (the same selection as before is fine). Select “OK”.

SSRS is now configured to use SSL/TLS!
Author: Jeremy Schatten Published: 11-10-2021
Next Guide...
Ssl installation guide for apache on redhat linux (rhel).
Red Hat Enterprise Linux (RHEL) is a Linux-based operating system from Red Hat designed for organizations. RHEL can work on desktops, on servers, in hypervisors or in the cloud. Red Hat and its community-supported counterpart, Fedora, are among the most widely used Linux distributions in the world.…
- SQL Server training
- Write for us!

How to create a SQL Server Reporting Services (SSRS) report
SQL Server Reporting Services (SSRS) is part of Microsoft SQL Server services since version 2000. If you are an ordinary user with a basic knowledge of SQL, this article will help you in creating your first SSRS report.
Requirements for creating a SSRS report
Before you begin using SSRS and creating reports you must have:
- Microsoft SQL Server 2014 database engine
- SQL Server 2014 reporting service (SSRS)
- SQL Server data tools
- AdventureWorks2012 database is used for this article, as data source .
Create a report server project
The first thing to do is to create a report server project because we will need this later for saving report definition files and any other files that you need for creating SSRS reports.
- The first step is to open SQL Server Data Tools . Click on the File menu, find New and then Project .
- After this, you need to click on the Business Intelligence .
- Click on the Reporting Services and then Report Server Project .
- If you want to display Report test project to get you started, you can type Report test in Name

Create a new report definition file
- In the View menu find the Solution Explorer , and then right-click on the Reports folder. In the Add section click New Item .
- In the window Add New Item , click Report .
- As you can see Report Designer has two available views. In Design view you define your report layout, and in the Preview view you can run your report.
Defining data source and dataset
Setting up a connection
In order to retrieve data from a database or from some other resource, you will need to define the data source. In the following section, you will see how you can define the data source. We will use AdventureWorks2012 database as an example.
- In the View menu find and click Report Data, then New and after that Data Source
- Type AdventureWorks2012 in the field Name
- Select Embedded connection
- As Type select Microsoft SQL Server

Note: If the database is not on the local computer, replace localhost with name of your database server instance.
- After this, click on the Credentials and then Use Windows Authentication.

Define a T-SQL query for report data
In this section you will learn how to specify a dataset . You will need some basic SQL knowledge in order to create a query and define what information you will need from your database. The query you will see is just an example, and for your own purposes and database, you will have to change that step.
- In the Report Data pane find and click New , and then Dataset .
- In the Dataset Properties dialog box as Name type DataSet1
- Make sure to check Use a dataset embedded in my report .
- Then select a AdventureWorks2012 as your data source ,

Note: soh, pps, sd, pp, ppc are just shorter names for tables that we have in AdventureWorks2012 database.
How to add a table and fields to a report layout
After finishing with previous technical details, we can start with more interesting things, like designing your first SSRS report. This part is easy because instead of writing code, you can drag-and-drop graphic icons into the report format. This section will show you how to add Table and Fields to your report.
- In the View menu click Toolbox, then find and click Table and drag the mouse to the design area.
- In the left pane, you can expand the dataset Dataset1 in order to see all the fields.
- Drag one of the field (e.g. field Date) from Report Data to the column in the table

Preview report
If you want to preview your report to see how it all looks, to correct errors, to correct issues or to verify design and data connection, click tab Preview.
Tips and tricks
An easier way to add a table is to right-click on the design surface, click Insert and then click Table.
How to format your Report
Format currency and date
If you want to format Date field to show only the date, follow the steps below:
- In the Design tab, right-click the desired cell, then click Text Box Properties.
- Find and click Number , then in the field Category click Date

If in your table you have a field that holds information about currency, but you only see ordinary numbers, you can format that field to display a number as currency:
- Find and click Number , then in the field Category click Currency
- In accordance to your need you can change defaults

Changing column width and text style
You also have an option to change text style (font, size etc.), and to change column width . Column width you can change by simply dragging the columns to the desired size.
Text style you can change by clicking the Format menu. In Format menu find Font , then click whatever you need (bold, italic, etc.)
Adding Grouping
If you want to make data set in your SSRS report do the following:
- Click Design tab, and then choose pane Row Groups
- Drag the field you want to group to the pane Row Groups
- From your report pane drag some other field you want to group.
- Delete the old columns to the double line.

You can do the same by right-clicking on the surface and clicking View , and then Grouping.
Adding totals
Total is the sum of numeric, non-null data in the data region, and if you want to add totals for a group, you can do that by clicking Add Total for the group in the Grouping pane, and if you want to add totals for an individual cell just click Add Total for the cell.
Add a daily total and grand total
- Right click the cell [Order] and choose Add total , then click After .
- Type Daily to format a new name, Daily Total
- After that, select the new cell [Daily Total], two Sum cells and the empty cell you see between them.

- Right click the cell [Date] and choose Add total , and then After .
- Type Grand to format a new name, Grand Total
- Select the new cell [Grand Total], the two [Sum] cells and the empty cell you see between them.

After you add total, you can change the default function Sum. There is a list of different function you can use (avg, count, etc.).
Publish your Report to the report server
Finally, when you finished with creating your first SSRS report, you may want to publish the report:
- In the Project menu click Test report Properties
- Put your report server’s name in the field TargetServerURL, then click OK.
- In the Build menu click Deploy Test report . You will get a message that indicates whether you have successful or unsuccessful deployment.
Note: A problem will occurred if you don’t have permissions on the report server or if you have been using SSDT with administrator privileges.
Most common problems
The most common problem in publishing the report to the report server is configuring the target server URL.
The first step that you need to do in configuration is to launch the SQL Server Reporting Service Configuration Manager and connect to the Reporting Service .

After that in section Web Service URL you can find URL to the report server.

In section Report Manager URL you can see URL for viewing and managing reports.

In the Project menu open the Test report Properties .
Note : Prefix “Test report” is name of your report.
Final step in configure target server URL is to fill the Web Service URL in the TargerServerURL property with correct URL that you find in Report Manager URL .

Congratulation, you have successfully created your first SSRS report!
Reporting Services (SSRS) Reporting Services Concepts (SSRS) Reporting Services Backward Compatibility Cause and Resolution of Reporting Services Errors
- Recent Posts

- How to create a SQL Server Reporting Services (SSRS) report - September 9, 2016
Related posts:
- Report filtering: Excel slicer vs SQL Server Reporting Services (SSRS) parameters
- How to create a simple SSRS Report using a SSAS Tabular model database
- How to automatically create KPIs in SQL Server Reporting Services
- How to create and configure the Tree Map Chart in SQL Server 2016 Reporting Services
- Reporting in SQL Server – create a matrix based sub-report called by the previously created main report
TechRepublic
Account information.

Share with Your Friends
10 Best Reporting Tools and Software of 2024
Your email has been sent

- Best for comprehensive data integration: Zoho Analytics
- Best for task-based reporting: Asana
- Best for high-level project reporting: Hive
- Best for data-driven decision-making: Google Looker
- Best for customizable project reporting: Wrike
- Best for visual project tracking: monday.com
- Best for all-in-one project management: ClickUp
- Best for agile project management: Jira Software
- Best for data visualization: Tableau
- Best for Microsoft ecosystem integration: Power BI
Reporting tools and software are crucial to teams, especially in terms of project management as they provide a structured way to track progress, identify risks and make informed decisions. They offer a sweeping view of project health that helps managers to not only pinpoint areas of concern but also identify successes. With effective reporting, an organization gets transparency and ensures its stakeholders are aligned, which plays a part in making projects successful since everyone involved has access to the same information and insights. We’ve analyzed 10 top reporting tools and software worth your consideration.
Featured Partners

Top reporting software: Comparison table
Zoho analytics: best for comprehensive data integration.
Zoho Analytics is a reporting tool that excels at aggregating data from a wide array of sources as it connects with over 250 data sources, including files, feeds, databases and cloud services. Its comprehensive suite of reporting options includes charts, pivot tables, summary views, tabular views and more. Zoho Analytics also offers an intuitive drag-and-drop interface to further simplify the report creation process and make it accessible for users of varying skill levels.
Zoho Analytics offers plans starting at $22 per month for the Basic plan, while the Standard, Premium and Enterprise plans cost $45, $112 and $445 per month, respectively, when billed annually. There’s also a Custom plan for prospective users to share their requirements.
- Extensive data integration from over 250 sources.
- Data preparation and management tools for accurate analysis.
- A wide array of visualization options for insightful reporting ( Figure A ).
- AI and ML-powered augmented analytics for guided insights.

Integrations
Zoho Analytics’s integrations include Zoho CRM, Salesforce CRM, Microsoft Dynamics CRM, HubSpot CRM and Zoho Bigin.
- Comprehensive data integration capabilities.
- Wide range of visualization tools.
- Advanced augmented analytics features.
- May be complex for beginners.
- Customization can require a learning curve.
Why we chose Zoho Analytics
We selected Zoho Analytics for its broad range of reporting capabilities and user-friendly design. Its ability to present data in various visual formats makes analysis flexible and insightful and caters to diverse reporting needs as well as a wide variety of users.
Learn more about other Zoho products, like Zoho Projects and Zoho Vault .
Asana: Best for task-based reporting

Asana simplifies project management with its Universal Reporting feature, which provides teams with a clear overview of task progress and project health. Its visual reporting format is designed for easy interpretation, meaning that users at all levels within an organization can easily access and use Asana.
Asana’s paid plans include the Premium plan at $10.99 per user per month, billed annually, and the Business plan at $24.99 per user per month. Its Enterprise plan’s pricing hasn’t been listed publicly.
- Visual and intuitive reporting tools for task and project tracking ( Figure B ).
- Goal tracking to align daily tasks with strategic objectives.
- Real-time updates to keep teams informed on project progress.
- A variety of highly customizable charts.

Asana’s top integrations include Microsoft Teams, Slack, the Asana for Gmail add-on, Asana for Adobe Creative Cloud and Google Calendar.
- User-friendly reporting and task management.
- Effective goal alignment features.
- Wide range of integrations.
- Limited depth in analytical features.
- Real-time analytics are somewhat restricted.
Why we chose Asana
We simply selected Asana for its user-friendly approach to task-based reporting. Asana is also highly effective when it comes to aligning tasks with organizational goals.
For more information, check out our full Asana review .
Hive: Best for high-level project reporting

Hive is recognized for its high-level reporting capabilities, offering a suite of options for a variety of project management use cases. With features like goals, analytics dashboards and timesheet reporting, Hive provides a comprehensive tool for gaining visibility and gathering insights into projects.
Hive has two premium plans atop a free plan. Teams at $12 per user per month when billed annually and $18 when billed monthly, and Enterprise, whose prices aren’t publicly listed.
- Goals for setting, tracking and monitoring goals across teams.
- Analytics dashboards to showcase project status, project breakdowns and more.
- Timesheets reporting to analyze data across timesheets.
- Multiple views like Portfolio, Summary, Table, Kanban and more ( Figure C ).

Hive’s top integrations include Google Calendar, Gmail, Google Sheets, Google Drive and Slack.
- Customizable high-level reporting options.
- Variety of views for different reporting needs.
- Efficient project and action management features.
- May require initial setup time to customize views.
- Some advanced features might be available only on higher-tier plans.
Why we chose Hive
We selected Hive for its versatile high-level reporting options and customizable views. They bring a flexible and comprehensive overview to projects.
For more information, check out our full Hive review .
Google Looker: Best for data-driven decision-making

A rather different entry from most tools on this list, Google Looker stands as a unified business intelligence platform that excels at turning data into actionable insights. It offers self-service BI that allows users to access, analyze and act on up-to-date, trusted data. As a reporting tool, Looker offers reliable data experiences at scale and empowers users with real-time insights.
Looker has a 30-day free trial, and its Standard plan costs $5,000 per month. For an annual quote, as well as quotes for the Enterprise and Embed plans, contact Google sales.
- Embedded analytics and applications for enhanced data experiences.
- Data modeling to unify business metrics across teams and applications.
- Real-time insights to empower users with up-to-date information.
- An extensive template gallery for templates on many of Google’s applications ( Figure D ).

Looker offers extensive integration capabilities, including BigQuery, Spanner, Cloud SQL and Cloud Storage.
- Unified platform for all BI needs.
- Real-time insights for up-to-date decision-making.
- Extensive integration capabilities with data sources.
- Pricing transparency could be improved.
- May require a learning curve to fully utilize advanced features.
Why we chose Google Looker
Google Looker’s reporting capabilities can be seen particularly through its embedded analytics and real-time insights. It easily unifies business metrics across teams and applications. It’s also a great tool for users predominantly using applications in the Google ecosystem.
Wrike: Best for customizable project reporting

Wrike stands out for its highly customizable reporting features. This flexibility, combined with Wrike’s thorough resource management and advanced analytics, makes Wrike competent enough to provide detailed insights into project performance and resource allocation and flexible enough to adapt to various workflows.
Wrike has five plans: the ones with prices listed are the Free plan, Team plan at $9.80 per user per month and Business plan at $24.80 per user per month. The Enterprise and Pinnacle plans’ pricing plans aren’t publicly listed.
- Customizable reports for tailored project insights ( Figure E ).
- Resource management to monitor progress and identify risks.
- Advanced analytics for deep visibility into project performance.

Wrike’s top integrations include Jira, GitHub, Google Sheets, Azure DevOps and HubSpot.
- Highly customizable reporting options.
- Comprehensive project and resource monitoring.
- Advanced analytics capabilities.
- Customization options may require time to master.
- Extensive features can be overwhelming for newcomers.
Why we chose Wrike
Wrike has robust reporting capabilities and customizable features, which give users the flexibility and depth needed to gain extensive insights into their projects and resources.
For more information, check out our full Wrike review .
monday.com: Best for visual project tracking

monday.com is a favorite among teams that love visual task management and prioritize ease of use as it offers a visually intuitive platform for project tracking. Its advanced reporting features, such as stacked charts and workload views, provide a thorough overview of project progress and team capacity. monday.com’s dashboard customization is very flexible; this enables teams to mold their reporting to meet their project needs.
monday has a free plan and a handful of premium plans, namely, Basic at $9 per seat per month, billed annually, or $12 per seat billed monthly; Standard at $12 per seat per month, billed annually, or $14 per seat billed monthly; Pro at $19 per seat per month, billed annually, or $24 per seat billed monthly; and Enterprise, which offers customized pricing.
- Stacked charts for multi-dimensional data analysis.
- Workload views for balanced resource allocation.
- Pivot tables for detailed data breakdowns.
- Customizable dashboards for tailored project insights ( Figure F ).

Some of the best monday.com integrations include GitLab, OneDrive, Todoist, Slack and Microsoft Teams.
- Highly visual and intuitive interface.
- Advanced reporting for comprehensive project insights.
- Flexible dashboard customization.
- Can be overwhelming for new users due to numerous features.
- Some advanced features require higher-tier plans.
Why we chose monday.com
monday.com is a visually intuitive platform and has advanced reporting capabilities. It delivers a balance between visual project tracking and in-depth reporting.
For more information, check out our full monday.com review .
ClickUp: Best for all-in-one project management

ClickUp is recognized for its all-in-one approach to project management, offering a wide range of features from task management to time tracking and goal setting. Its reporting features are designed to provide teams with insights into productivity and project progress, supporting data-driven decision-making. ClickUp’s customizable dashboards and reporting tools allow teams to monitor key metrics and track performance effectively.
ClickUp offers a generous free forever plan alongside three premium tiers: Unlimited at $7 per user per month when billed annually, or $10 per user per month when billed monthly; Business at $12 per user per month when billed annually, or $19 per user per month when billed monthly; and Enterprise that needs prospective users to contact ClickUp for a custom quote.
- Comprehensive dashboards for project overview ( Figure G ).
- Customizable reporting for tailored insights.
- Goal tracking to align efforts with objectives.
- Time tracking to monitor task durations and productivity.

Some of ClickUp’s top integrations include Gmail, Zoom, HubSpot, Make and Google Calendar.
- Versatile all-in-one project management solution.
- Extensive customization options for dashboards and reporting.
- Generous free plan with substantial features.
- Steep learning curve due to feature richness.
- Customization can be time-consuming.
Why we chose ClickUp
We included ClickUp because of its comprehensive feature set and flexibility, offering teams an all-in-one solution for project management and reporting. It proves suitable for a wide range of project types and sizes.
For more information, check out our full ClickUp review .
Jira Software: Best for agile project management
Jira Software is tailored for agile project management with specialized reporting features like sprint reports, burndown charts and velocity charts. These agile-centric reports give teams critical insights into their agile processes to help them optimize workflows and improve sprint planning. It’s worth considering for software development teams and those that follow scrum or kanban frameworks.
Jira offers a free plan for 10 users max. Its premium plans are the Standard plan at about $8.15 per user per month and the Premium plan at about $16 per user per month. It also offers an Enterprise plan that’s billed annually. However, you need to contact Jira for a quote.
- Sprint reports for tracking sprint progress ( Figure H ).
- Burndown charts for visualizing task completion.
- Velocity charts for assessing team performance over sprints.
- Cumulative flow diagrams for Kanban teams.

Jira has extensive integrations with development tools like Bitbucket, Confluence, GitHub, Opsgenie, Jenkins and Dynatrace.
- Tailored for agile project management.
- Comprehensive reporting for scrum and kanban teams.
- Wide range of integrations with development tools.
- Primarily focused on software development teams.
- Can be complex for non-technical users.
Why we chose Jira Software
Jira Software has robust agile reporting features and is capable of providing deep insights into agile project management processes, especially for teams practicing scrum or kanban methodologies.
For more information, check out our full Jira Software review .
Tableau: Best for data visualization
Tableau sets the standard for data visualization, offering a wide range of chart types and interactive dashboards that make complex data understandable at a glance. As reporting software, it offers a user-friendly interface and powerful data handling capabilities for users to create detailed and insightful visual reports.
Tableau’s pricing starts at $15 per user per month, with its highest tier costing $75 per user per month, both billed annually.
- Wide range of visualization options.
- User-friendly interface for non-technical users ( Figure I ).
- Powerful data handling and processing capabilities.

Tableau’s top integrations include Salesforce, Google Analytics, Microsoft Excel, Amazon Redshift and Snowflake.
- Leading data visualization capabilities.
- Intuitive interface for easy use.
- Strong data connectivity options.
- Higher price point compared to some competitors.
- Can require significant resources for large datasets.
Why we chose Tableau
We considered Tableau because of its unparalleled data visualization capabilities and user-friendly interface. It should make it to your shortlist if your teams value both data accessibility and detailed reporting.
For more information, check out our full Tableau review .
Power BI: Best for Microsoft ecosystem integration
Power BI is a key player in the reporting and analytics space, especially for those deeply embedded in the Microsoft ecosystem. Its seamless integration with other Microsoft products, like Excel and Azure, makes it a no-brainer for teams that want compatibility and ease of use with their reporting tools. What makes it a great reporting and analytics tool is its ability to handle large datasets and provide advanced analytics, including AI capabilities and custom visualizations.
Power BI offers a free version, with premium plans starting at $10 per user per month for the Pro plan and $20 per user per month for the Premium plan.
- Seamless integration with Microsoft products.
- Advanced analytics with AI capabilities.
- Custom visualizations for personalized reporting ( Figure J ).

Aside from a variety of tools in the Microsoft ecosystem like Microsoft Office 365, Power BI’s top integrations include Asana, HubSpot, Google Sheets and Salesforce Pardot.
- Strong Microsoft integration.
- Comprehensive analytics and AI features.
- Flexible pricing with a robust free version.
- Can be complex for new users.
- Limited integration outside the Microsoft ecosystem.
Why we chose Power BI
We chose Power BI due to its strong analytics capabilities combined with its seamless integration with tools in the Microsoft ecosystem. It’s a particularly fitting choice for teams that already use Microsoft products.
For more information, check out our full Power BI review .
Key features of reporting software
Real-time analytics.
Real-time analytics allows users to view, assess and analyze data as it flows into the business, which can be displayed on dashboards or reports. With this, users get to make decisions faster since they get instant, descriptive insights from the most current data.
Custom reports
Custom reports save time as they automate the data gathering and report generation processes. After the initial setup, reporting processes can be entirely streamlined, with live data feeds ensuring that any additional requests can be quickly addressed by making changes to existing reports.
Dashboard customization
Dashboard customization is crucial in reporting software as it allows users to set up their reporting environment based on their needs. Custom dashboards can provide in-depth data on various aspects of business operations, illustrating potential revenue and areas where improvements are needed. Businesses can mix and match data sources for a comprehensive view of their digital environment.
Automated reporting
This kind of reporting streamlines the process of generating regular reports and reduces the manual effort required while making sure that stakeholders receive timely updates. Users can schedule report generation and ensure that reports are always current and reflect the latest data.
Data visualization
Data visualization transforms complex datasets into graphical representations, making it easier to understand trends, patterns and outliers. This feature helps to make data more accessible and actionable, which enables users to quickly grasp the insights presented in the data.
How do I choose the best reporting software for my business?
First things first, when it comes to choosing the best reporting software for you, you must match a tool’s capabilities to your needs. For small to medium-sized businesses, tools like Zoho Analytics and ClickUp offer a vast feature set at a more accessible price point, which makes them great options when seeking value without compromising on functionality. Larger enterprises or those with more complex reporting and data analysis needs might lean towards Power BI or Tableau, known for their advanced analytics and integration within larger ecosystems.
Consider the types of reports you need, the data you’re working with and who will be using the tool. For teams that prioritize real-time data and collaboration, monday.com and Asana provide user-friendly interfaces and seamless integration with other productivity tools. On the other hand, if your focus is on in-depth data analysis and visualization, Tableau’s extensive customization options and Power BI’s deep Microsoft integration stand out.
In essence, the best reporting tool is one that not only fits your budget and technical requirements but also grows with your business, adapting to changing needs and helping you make informed decisions based on accurate, up-to-date data.
Methodology
Our approach to identifying the top reporting tools for 2024 involved a detailed examination of each tool’s core features, ease of use, use cases and pricing. This allowed us to provide popular tools that cut across industries, use cases and team sizes. Additionally, we tested the tools where possible to understand how they approached reporting and compared our findings to verified reviews by real users. From this, we got to understand the pros and cons of each tool.
Subscribe to the Project Management Insider Newsletter
Subscribe to Project Management Insider for best practices, reviews and resources. From project scheduling software to project planning apps, stay up to date with the latest in project management tools. Delivered Wednesdays
- The Best Project Management Software and Tools for 2024
- The Best Simple Project Management Software of 2024
- The Best Project Management Certifications in 2024
- Telephone Interview Cheat Sheet: Project Manager
Create a TechRepublic Account
Get the web's best business technology news, tutorials, reviews, trends, and analysis—in your inbox. Let's start with the basics.
* - indicates required fields
Sign in to TechRepublic
Lost your password? Request a new password
Reset Password
Please enter your email adress. You will receive an email message with instructions on how to reset your password.
Check your email for a password reset link. If you didn't receive an email don't forgot to check your spam folder, otherwise contact support .
Welcome. Tell us a little bit about you.
This will help us provide you with customized content.
Want to receive more TechRepublic news?
You're all set.
Thanks for signing up! Keep an eye out for a confirmation email from our team. To ensure any newsletters you subscribed to hit your inbox, make sure to add [email protected] to your contacts list.
Please enter your information to subscribe to the Microsoft Fabric Blog.
Microsoft fabric updates blog.
Announcing the Public Preview of Mirroring in Microsoft Fabric
- Announcements
- Data Engineering
- Data Science
- Data Warehouse
We are excited to announce that Mirroring, previously announced at Ignite in November 2023, is now available to customers in Public Preview. You can now seamlessly bring your databases into OneLake in Microsoft Fabric, enabling seamless zero-ETL, near real-time insights on your data – and unlocking warehousing, BI, AI, and more.
Data driven insights are important for every business. With the critical need to make smart decisions, create new things, improve your products or services – time to value is everything. Yet, this can be difficult when you have data in different places, like apps, databases, and data warehouses. These places typically store data differently, so you can’t easily analyze and cross reference them – you have to laboriously move their data to a place where you can analyze and harmonize at scale. Doing this takes time, money, and typically, costly expertise to build complex, connected solutions. By the time you do this your data is old, and your insights are out of date. Decision makers need to be able to ask questions about their data, without time consuming complexity that adds risk and can impact mission critical workloads.
Mirroring simplifies this process into clicks and seconds, not complex processes and hours, days, or weeks. You get a modern, fast, and safe way of accessing and ingesting data continuously and seamlessly from databases or data warehouses into Fabric’s OneLake, without the need for cumbersome pipelines – in near real time. Combined with the rest of your organization’s data in OneLake, you can quickly unify and govern your data estate, removing data silos. Sound like a win-win?
Let’s jump in.
Easily Mirror your database or data warehouse’s data
Mirroring enables your database to be securely accessed and managed centrally from within Fabric without having to switch database clients or install any software. By just providing connection details and securely logging in, your database is instantly available in Fabric as a Mirrored database.

Frictionless, real-time data replication
There is no complex setup or ETL for data replication. With the same connection details, data is updated in a reliable way continuously, no intervention or code needed. An initial snapshot is created after which data is kept in sync in near real-time with every transaction whenever a new table is created, or new data is inserted/updated/deleted.
Replication uses the source database’s Change Data Capture (CDC ) technology, transforms it into appropriate Delta tables and lands it in OneLake. Intelligent logic determines when the source has changed, ensuring compute isn’t used unnecessarily before replicating the data. Granular controls enable configuring what is mirrored into Fabric. Detailed monitoring is also available to gain insights into mirroring operations and when the replica in Fabric OneLake was last refreshed. From here on, the data is ready for consumption immediately in any Fabric workload.

Data warehousing experiences simplified
Every Mirrored database comes with default data warehousing experiences (and the industry leading security capabilities) via a SQL Analytics Endpoint which houses the metadata of the Delta tables and points to the data in OneLake. Whether a SQL developer or citizen developer, one can query using the T-SQL editor which comes with full Intellisense or the visual query editor.
Pro code:

No code:

Easily join data across Mirrored databases, Warehouses, Lakehouses
As you may know, all data in Fabric is already in Delta format in OneLake. This includes Mirrored data. Any Mirrored database can be cross joined with other databases, warehouses or lakehouses whether that be data in Azure Cosmos DB, Azure SQL DB, Snowflake, etc.

Data Science experiences unlocked
Because a single copy of the data lives in OneLake, any data scientist can create a Lakehouse with a shortcut to the Mirrored database and use Notebooks to analyze and create models with the data.

Power BI Direct Lake – enabling clicky-clicky, draggy-droppy, analysis
With the same data, Power BI reports and semantic models can be built in Direct Lake mode – leveraging the blazing fast performance of import mode but without duplicating the data. As Direct Lake mode also supports reading Delta tables right from OneLake, the Mirrored database is Power BI ready.

What early adopters are saying
Since late last year’s announcement, we’ve seen many customers in the private preview analyzing their data, finding new insights, and providing much appreciated feedback. Below we’ve captured a few snippets:
- “Cosmos DB Mirroring is revolutionizing No-ETL design patterns, providing near-real-time data synchronization into the Delta format, where the mirrored data can easily be accessed by a variety of Fabric tools optimized to work with Delta. The technology is enabling us to reduce our code footprint, eliminate costs associated with data ingestion, and speed time to analytics without impacting the performance of operational data stores.” Ann Wallinger, Engineering Specialist, R&D, Baxter
- “The ability to cross-query mirrored Cosmos and SQL databases from Fabric will change how quickly we are able to innovate in our ever-changing data world. Very excited” Jacob Corey, VP of Data Solutions, Netrush, LLC
- “At Unite Digital, our primary data storage solution is Cosmos DB. To facilitate reporting, we conduct daily ETL processes that transfer data from Cosmos DB to Fabric. The introduction of Cosmos DB Mirroring for Fabric presents an opportunity to streamline this process significantly, providing near real-time data availability for reporting purposes within Microsoft Fabric. This integration has proven to be straightforward to implement and has functioned flawlessly. The capability to offer near real-time reporting in a domain where the norm is a 24-48 hour turnaround time for reports serves as a distinct competitive edge. We have plans to phase out our traditional ETL processes in favor of transitioning entirely to Cosmos DB Mirroring for Fabric upon its general availability.” Shahid Syed, Director of Technology and Security Compliance, Unite Digital
- “By streamlining transfer of data from Azure SQL DB to Fabric, Mirroring not only saves us time and money, but also allows us to conveniently support near real time analytics” Dhyan, Product Manager, Data Platform, Ramsoft
- “After having tested Mirroring under private preview, we are convinced, that it will play a central part in our Enterprise Fabric. Being able to seamlessly mirror any CosmosDB or Azure SQL Database to OneLake with just a few clicks will dramatically speed up development of new data products, minimize risk and reduce technical debt.” Jacob Rønnow Jensen, Head of Department for Data Platform, AP Pension
Mirroring Availability
Today, Azure Cosmos DB, Azure SQL DB, and Snowflake customers on any cloud will be able to mirror their data in OneLake and unlock all the capabilities of Fabric’s Data Warehouse, Direct Lake Mode in Power BI, Notebooks and much more. Besides the support for Azure Cosmos DB, Azure SQL Database, Snowflake in Mirroring, many more data sources will be added based on your feedback. You can help us prioritize what’s next by adding an idea here: https://aka.ms/fabricideas . In the meanwhile, stay tuned to the roadmap for updates: https://aka.ms/FabricRoadmap
Pricing:
We’re excited to announce that Mirroring storage and compute cost is free, providing generous amounts (terabytes) of storage based on the capacity size. This enables your organization to focus on finding valuable analytics scenarios unlocked by Mirroring.
For example, if you purchase an F2 capacity, compute for mirroring is not billed and you get 2 free terabytes worth of storage exclusively for mirroring. OneLake storage is billed only when the free Mirroring storage limit is exceeded, or the capacity is paused.
Learn more about Mirroring
- Get Started with a Fabric free trial
- Overview of Mirroring in Microsoft Fabric
- Mirrored Azure SQL Database in Fabric
- Mirrored Cosmos DB in Fabric
- Mirrored Snowflake in Fabric
- Turn it on for your organization, specific groups, or specific users
- OneLake Storage allotment by SKU
- Vote for new data sources or features for Mirroring
Related blog posts
Announcing folder in workspace in public preview.
In the past, a workspace would always end up being filled by hundreds of items as the project progressed. It would become harder and harder to find an item, or to put related items in the same place. This leads to cluttered workspaces and decreased productivity during collaboration. Today, we are very excited to announce … Continue reading “Announcing Folder in Workspace in Public Preview”
Fabric Real-Time Analytics Integrates with Newly Announced Database Watcher for Azure SQL
Users of Azure SQL can now take advantage of an enhanced monitoring solution for their databases and leverage integration with Microsoft Fabric. With the introduction of the new Database Watcher for Azure SQL (preview), users gain access to advanced monitoring capabilities. Through integration with Microsoft Fabric, they can effortlessly stream, store, and analyze monitoring data … Continue reading “Fabric Real-Time Analytics Integrates with Newly Announced Database Watcher for Azure SQL”

AI + Machine Learning , Announcements , Azure AI , Azure AI Content Safety , Azure AI Studio , Azure OpenAI Service , Security
Announcing new tools in Azure AI to help you build more secure and trustworthy generative AI applications
By Sarah Bird Chief Product Officer of Responsible AI, Microsoft
Posted on March 28, 2024 6 min read
- Tag: Generative AI
In the rapidly evolving landscape of generative AI, business leaders are trying to strike the right balance between innovation and risk management. Prompt injection attacks have emerged as a significant challenge, where malicious actors try to manipulate an AI system into doing something outside its intended purpose, such as producing harmful content or exfiltrating confidential data. In addition to mitigating these security risks, organizations are also concerned about quality and reliability. They want to ensure that their AI systems are not generating errors or adding information that isn’t substantiated in the application’s data sources, which can erode user trust.
To help customers meet these AI quality and safety challenges, we’re announcing new tools now available or coming soon to Azure AI Studio for generative AI app developers:
- Prompt Shields to detect and block prompt injection attacks, including a new model for identifying indirect prompt attacks before they impact your model, coming soon and now available in preview in Azure AI Content Safety.
- Groundedness detection to detect “hallucinations” in model outputs, coming soon.
- Safety system messages to steer your model’s behavior toward safe, responsible outputs, coming soon.
- Safety evaluations to assess an application’s vulnerability to jailbreak attacks and to generating content risks, now available in preview.
- Risk and safety monitoring to understand what model inputs, outputs, and end users are triggering content filters to inform mitigations, coming soon, and now available in preview in Azure OpenAI Service.
With these additions, Azure AI continues to provide our customers with innovative technologies to safeguard their applications across the generative AI lifecycle.
Safeguard your LLMs against prompt injection attacks with Prompt Shields

Prompt injection attacks, both direct attacks, known as jailbreaks, and indirect attacks, are emerging as significant threats to foundation model safety and security. Successful attacks that bypass an AI system’s safety mitigations can have severe consequences, such as personally identifiable information (PII) and intellectual property (IP) leakage.

To combat these threats, Microsoft has introduced Prompt Shields to detect suspicious inputs in real time and block them before they reach the foundation model. This proactive approach safeguards the integrity of large language model (LLM) systems and user interactions.

Prompt Shield for Jailbreak Attacks: Jailbreak, direct prompt attacks, or user prompt injection attacks, refer to users manipulating prompts to inject harmful inputs into LLMs to distort actions and outputs. An example of a jailbreak command is a ‘DAN’ (Do Anything Now) attack, which can trick the LLM into inappropriate content generation or ignoring system-imposed restrictions. Our Prompt Shield for jailbreak attacks, released this past November as ‘jailbreak risk detection’, detects these attacks by analyzing prompts for malicious instructions and blocks their execution.

Prompt Shield for Indirect Attacks: Indirect prompt injection attacks, although not as well-known as jailbreak attacks, present a unique challenge and threat. In these covert attacks, hackers aim to manipulate AI systems indirectly by altering input data, such as websites, emails, or uploaded documents. This allows hackers to trick the foundation model into performing unauthorized actions without directly tampering with the prompt or LLM. The consequences of which can lead to account takeover, defamatory or harassing content, and other malicious actions. To combat this, we’re introducing a Prompt Shield for indirect attacks, designed to detect and block these hidden attacks to support the security and integrity of your generative AI applications.
Identify LLM Hallucinations with Groundedness detection

‘Hallucinations’ in generative AI refer to instances when a model confidently generates outputs that misalign with common sense or lack grounding data. This issue can manifest in different ways, ranging from minor inaccuracies to starkly false outputs. Identifying hallucinations is crucial for enhancing the quality and trustworthiness of generative AI systems. Today, Microsoft is announcing Groundedness detection, a new feature designed to identify text-based hallucinations. This feature detects ‘ungrounded material’ in text to support the quality of LLM outputs.
Steer your application with an effective safety system message
In addition to adding safety systems like Azure AI Content Safety , prompt engineering is one of the most powerful and popular ways to improve the reliability of a generative AI system. Today, Azure AI enables users to ground foundation models on trusted data sources and build system messages that guide the optimal use of that grounding data and overall behavior (do this, not that). At Microsoft, we have found that even small changes to a system message can have a significant impact on an application’s quality and safety. To help customers build effective system messages, we’ll soon provide safety system message templates directly in the Azure AI Studio and Azure OpenAI Service playgrounds by default. Developed by Microsoft Research to mitigate harmful content generation and misuse, these templates can help developers start building high-quality applications in less time.
Evaluate your LLM application for risks and safety

How do you know if your application and mitigations are working as intended? Today, many organizations lack the resources to stress test their generative AI applications so they can confidently progress from prototype to production. First, it can be challenging to build a high-quality test dataset that reflects a range of new and emerging risks, such as jailbreak attacks. Even with quality data, evaluations can be a complex and manual process, and development teams may find it difficult to interpret the results to inform effective mitigations.
Azure AI Studio provides robust, automated evaluations to help organizations systematically assess and improve their generative AI applications before deploying to production. While we currently support pre-built quality evaluation metrics such as groundedness, relevance, and fluency, today we’re announcing automated evaluations for new risk and safety metrics. These safety evaluations measure an application’s susceptibility to jailbreak attempts and to producing violent, sexual, self-harm-related, and hateful and unfair content. They also provide natural language explanations for evaluation results to help inform appropriate mitigations. Developers can evaluate an application using their own test dataset or simply generate a high-quality test dataset using adversarial prompt templates developed by Microsoft Research. With this capability, Azure AI Studio can also help augment and accelerate manual red-teaming efforts by enabling red teams to generate and automate adversarial prompts at scale.
Monitor your Azure OpenAI Service deployments for risks and safety in production

Monitoring generative AI models in production is an essential part of the AI lifecycle. Today we are pleased to announce risk and safety monitoring in Azure OpenAI Service. Now, developers can visualize the volume, severity, and category of user inputs and model outputs that were blocked by their Azure OpenAI Service content filters and blocklists over time. In addition to content-level monitoring and insights, we are introducing reporting for potential abuse at the user level. Now, enterprise customers have greater visibility into trends where end-users continuously send risky or harmful requests to an Azure OpenAI Service model. If content from a user is flagged as harmful by a customer’s pre-configured content filters or blocklists, the service will use contextual signals to determine whether the user’s behavior qualifies as abuse of the AI system. With these new monitoring capabilities, organizations can better-understand trends in application and user behavior and apply those insights to adjust content filter configurations, blocklists, and overall application design.
Confidently scale the next generation of safe, responsible AI applications
Generative AI can be a force multiplier for every department, company, and industry. Azure AI customers are using this technology to operate more efficiently , improve customer experience , and build new pathways for innovation and growth . At the same time, foundation models introduce new challenges for security and safety that require novel mitigations and continuous learning.
Invest in App Innovation to Stay Ahead of the Curve
At Microsoft, whether we are working on traditional machine learning or cutting-edge AI technologies, we ground our research, policy, and engineering efforts in our AI principles . We’ve built our Azure AI portfolio to help developers embed critical responsible AI practices directly into the AI development lifecycle. In this way, Azure AI provides a consistent, scalable platform for responsible innovation for our first-party copilots and for the thousands of customers building their own game-changing solutions with Azure AI. We’re excited to continue collaborating with customers and partners on novel ways to mitigate, evaluate, and monitor risks and help every organization realize their goals with generative AI with confidence.
Learn more about today’s announcements
- Get started in Azure AI Studio .
- Prompt Shields
- Groundedness detection
- Safety evaluations
- Risk and safety monitoring

Azure AI Studio
Build AI solutions faster with prebuilt models or train models using your data to innovate securely and at scale.
Let us know what you think of Azure and what you would like to see in the future.
Provide feedback
Build your cloud computing and Azure skills with free courses by Microsoft Learn.
Explore Azure learning
Related posts
AI + Machine Learning , Azure AI , Azure AI Services , Azure AI Studio , Azure Cosmos DB , Azure Kubernetes Service (AKS) , Azure OpenAI Service , Customer stories , Integration , Thought leadership
Microsoft Azure AI celebrates Women’s History Month through our customers chevron_right
AI + Machine Learning , Azure AI , Industry trends , Virtual Machines
Microsoft Azure delivers game-changing performance for generative AI Inference chevron_right
AI + Machine Learning , Azure AI , Azure AI Studio , Customer stories , Databases , Thought leadership
The Microsoft Intelligent Data Platform—Unleash your data and accelerate your transformation chevron_right
AI + Machine Learning , Announcements , Azure AI , Azure AI Studio , Azure Arc , Azure CycleCloud , Azure Machine Learning , Azure Synapse Analytics , Events , Partners
Microsoft and NVIDIA partnership continues to deliver on the promise of AI chevron_right
Microsoft SQL Server 2019 Reporting Services
SQL Server Reporting Services is a server-based reporting platform that provides comprehensive reporting functionality.
Important! Selecting a language below will dynamically change the complete page content to that language.
15.0.1102.1140
Date Published:
SQLServerReportingServices.exe
- Paginated reports optimized for document generation and printing.
- Mobile reports optimized for mobile devices, with responsive layout that adapts to different devices and the different ways you hold them.
- A modern web portal you can view in any modern web browser.
System Requirements
Supported Operating Systems
Windows Server 2019, Windows Server 2016, Windows 10, Windows 11, Windows Server 2022
- .NET Framework 4.7 or later
- SQL Server Database Engine (2012 SP4 or later), to store the report server database
- Download the Evaluation Edition of Microsoft SQL Server
Install Instructions
- Install SQL Server Reporting Services (SQLServerReportingServices.exe)
- Configure your report server using Report Server Configuration Manager
COMMENTS
Start the Reporting Services Configuration tool and connect to the report server. Select Web Service URL. Expand the list of TLS/SSL Certificates. Reporting Services detects server authentication certificates in the local store. If you installed a certificate and you don't see it in the list, you might need to restart the service.
Move down to the Report Manager URL section of the UI: From here, click Advanced to bring up the Advanced Multiple Web Site Configuration window, then click the Add button under Multiple SSL identities for Report Manager which brings up the Add a Report Manager SSL Binding window: From here, choose the IP Address, SSL Port and the certificate ...
In the Database Screen, type in the name of your database and click Next. In the Credentials Screen, you will choose the service credentials used by SSRS to connect to the database. You have 3 ...
use the following command in cmd (Command Prompt): netsh http show sslcert; remove the binding by using the following command: netsh http delete sslcert ipport=0.0.0.0:443; Once you are done, bind the URL again with the SSL certificate and this time it will go through. Test the URL and it should be working fine.
On the SQL Server open the Report Server Configuration Manager. Switch to Web Service URL. Click "Advanced" and click Add under HTTPS on the bottom of the window. Choose the certificate from the list and Click OK. The Reporting Service are now configured to use both HTTP and HTTPS traffic. Optionally - For better security the HTTP protocol ...
Multiple Web services or applications often share a port. For this reason, a report server URL always includes a virtual directory that corresponds to the application that gets the request. You must specify unique virtual directory names for each Reporting Services application that listens on the same IP address and port. SSL settings
Reporting Services Related configuration (SERVER 2) Before we start configuring the changes, I would like to tell you that a couple of months back this wasn't a supported scenario but right now Reporting Services can communicate with SQL Server using TLS 1.2 1.Install the Windows Patches
But it immediately tears the TCP session down because the application is TRYING TO FORCE TLS 1.0. TLS 1.0 is disabled on this box, so the Client Hello never gets sent and the application "SRSS" logs this as a Connection Failure. It's Important to understand that the TCP Connection worked but the TLS SESSION failed.
In this article. Applies to: SQL Server 2016 (13.x) Reporting Services and later Power BI Report Server. SQL Server Reporting Services (SSRS) provides a set of on-premises tools and services that create, deploy, and manage paginated reports. Download SQL Server 2022 Reporting Services from the Microsoft Download Center.
Microsoft SQL Server 2019 Reporting Services. SQL Server Reporting Services is a server-based reporting platform that provides comprehensive reporting functionality. Important! Selecting a language below will dynamically change the complete page content to that language. Select language. Download.
Microsoft SQL Server 2022 Reporting Services. SQL Server Reporting Services is a server-based reporting platform that provides comprehensive reporting functionality. Important! Selecting a language below will dynamically change the complete page content to that language. Select language. Download. Expand all.
Microsoft's SQL Server Reporting Services is a popular Business Intelligence framework. Through SSRS, administrators can analyze, collate, and synthesize data from a variety of sources into easy to consume web-based reports. It is common for third-party software to rely on the rich underpinnings of SSRS for integration purposes, choosing to ...
Microsoft SQL Server 2022 Reporting Services. SQL Server Reporting Services is a server-based reporting platform that provides comprehensive reporting functionality. Important! Selecting a language below will dynamically change the complete page content to that language. Select language. Download. Expand all.
Create a new report definition file. In the View menu find the Solution Explorer, and then right-click on the Reports folder. In the Add section click New Item.; In the window Add New Item, click Report.; As you can see Report Designer has two available views. In Design view you define your report layout, and in the Preview view you can run your report. ...
This web app works when making an http call to the SSRS server but never when making an https call. If you open up the Azure web app debug console, a powershell tnc command to port 80 and 443 of the SSRS server are successful. SSRS is https enabled and it works when using a browser.
SQL Server Reporting Services ( SSRS) is a server-based report generating software system from Microsoft. It is part of a suite of Microsoft SQL Server services, including SSAS ( SQL Server Analysis Services) and SSIS ( SQL Server Integration Services ). Administered via a web interface, it can be used to prepare and deliver a variety of ...
2. Open your project/Solution in SSRS tool. Select the report properties (Right click on report project and select properties). Update 'Overwrite dataset' and 'Overwrite datasource' as True. Then go to your shared Datasource properties and select 'credentials' section. There you can select 'Use this username and password' option and set ...
Hi All, I have both power bi and SSRS report (same report and same data source SQL Server VIEW). When I run the SSRS report in VS it renders the data in few seconds, same is the case with the Power BI report, it renders the data (half a million rows) in seconds from the desktop.
Zoho Analytics is a reporting tool that excels at aggregating data from a wide array of sources as it connects with over 250 data sources, including files, feeds, databases and cloud services.
Mirroring Azure SQL database creates an initial snapshot in Fabric OneLake after which data is kept in sync in near-real time with every transaction when a new table is created/dropped, or data gets updated. Key features. Mirroring for Azure SQL Database is built on the SQL's Change Data Capture (CDC) stack optimized for lake-centric ...
Whether a SQL developer or citizen developer, one can query using the T-SQL editor which comes with full Intellisense or the visual query editor. Pro code: No code: Easily join data across Mirrored databases, Warehouses, Lakehouses . As you may know, all data in Fabric is already in Delta format in OneLake. This includes Mirrored data.
Critical vulnerabilities: More dead Atlassian links. Atlassian leads the list this week with a CVSS 10.0 vulnerability (CVE-2024-1597) SQL injection bug in Bamboo Data Center and Server.While Atlassian has patched the issue, the matter isn't actually due to Atlassian's own code, but a "non-Atlassian Bamboo dependency."
Modernize SQL Server applications with a managed, always-up-to-date SQL instance in the cloud. Azure Database for MySQL Fully managed, scalable MySQL Database. SQL Server on Azure Virtual Machines Migrate SQL Server workloads to the cloud at lower total cost of ownership (TCO)
Microsoft SQL Server 2019 Reporting Services. SQL Server Reporting Services is a server-based reporting platform that provides comprehensive reporting functionality. Important! Selecting a language below will dynamically change the complete page content to that language. Select language. Download. Expand all.