Overview of QuickBooks Online Reports
Piotr Malek
Jul 07, 2022
Running accounting on QuickBooks inevitably means that you’ll need to fetch tons of reports every week, month, or quarter. Intuit’s platform lives up to expectations, providing an easy way to access your QuickBooks Online reports. Downloading them for external use requires plenty of manual work but there’s also a way to automate the process. We’ll show you how!

QuickBooks Online reports comparison
QuickBooks Online comes with three pricing plans, each with a varying set of features. The differences can also apply to the reports offered. However, because financial reporting is such an essential part of any business, there’s a wide range of reports available even on the lower Smart Start plan.
Open QuickBooks reports using the Accountant view
You can access the Reports center from the menu to the left.
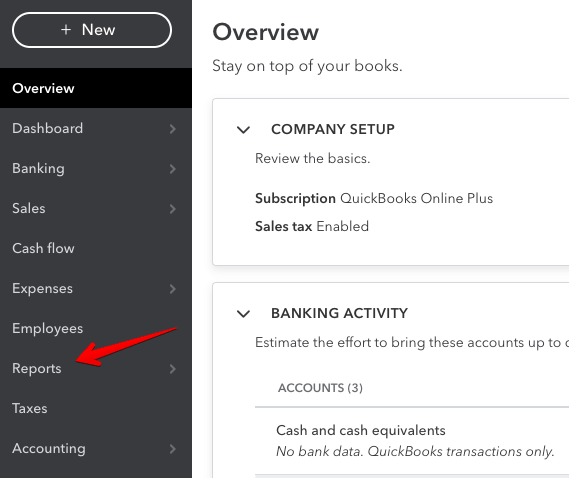
This section is split into two parts:
- Reports where all the available reports are stored, including standard, custom, and management reports.
- Performance center where you can view and create charts demonstrating the performance of your company.
As reports are the purpose of this article, we’ll focus solely on the first category for the duration of this article.
Open QuickBooks reports using the Business view
Go to Business Overview => Reports

You will see three tabs::
- Standard – standard reports available out of the box
- Custom reports – customized reports created by users of your QuickBooks Online account
- Management reports – customized reporting packages complete with cover page, table of contents, preliminary pages, reports and end notes.
Standard reports are grouped by their essence:
- Favourites: the reports you marked as favorite
- Business overview: Audit Log, Balance Sheet, and others
- Who owes you: Invoice List, Customer Balance Summary, and others
- Sales and customers: Customer Contact List, Sales by Customer Summary, and others
- What you owe: Unpaid Bills, Accounts payable ageing detail, and others
- Expenses and suppliers: Cheque Detail, Supplier Contact List, and others
- Sales tax: Tax Liability Report, VAT Summary Report, and others
- Employees: Employee Contact List, Recent/Edited Time Activities, and others
- For my accountant: General Ledger, Profit and Loss Comparison, and others
- Payroll: Time Activities by Employee Detail, Recent/Edited Time Activities, and others

Whereas, the availability of standard reports depends on the subscription plan you have.
Reports available on the Simple Start QuickBooks Online plan
The Simple Start plan features the following reports:
- Balance Sheet Comparison
- Balance Sheet Detail
- Balance Sheet
- Profit and Loss by % of Total Income
- Profit and Loss Comparison
- Profit and Loss year-to-date Comparison
- Profit and Loss by Customer
- Profit and Loss by Month
- Profit and Loss
- Quarterly Profit and Loss Summary
- Statement of Cash Flows
- Customer Contact List
- Deposit Detail
- Estimates by Customer
- Products and Services List
- Sales by Customer Summary
- Sales by Product/Service Summary
- Accounts receivable Summary
- Collections Report
- Customer Balance Summary
- Invoice List
- Open Invoices
- Statement List
- Check Detail
- Transaction List by Vendor
- Vendor Contact List
- Sales Tax Liability Report
- Taxable Sales Summary
- Account List
- General Ledger
- Recent Transactions
- Reconciliation Reports
- Statement of Cash Flow
- Transaction List by Date
- Trial Balance
- Employee Details
- Employee Directory
- Multiple Worksites
- Paycheck List
- Payroll Billing Summary
- Payroll Deductions/Contributions
- Payroll Details
- Payroll Summary
- Payroll Tax Liability
- Payroll Tax Payments
- Payroll Tax and Wage Summary
- Retirement Plans
- Total Payroll Cost
- Vacation and Sick Leave
- Workers’ Compensation
Users on the Simple Start plan can also customize reports as well as access management reports and compilations.
Reports available on the Essentials QuickBooks Online plan
The Essentials plan features all the reports available on the Smart Start plan, as well as:
- Balance Sheet Summary
- Business Snapshot
- Profit and Loss Detail
- Realized Exchange Gains & Losses
- Unrealized Exchange Gains & Losses
- Income by Customer Summary
- Payment Methods List
- Sales by Customer Detail
- Sales by Customer Type Detail
- Sales by Product/Service Detail
- Transaction List by Customer
- Unbilled Charges
- Accounts receivable aging Detail
- Customer Balance Detail
- Accounts payable aging detail
- Accounts payable aging summary
- Bill Payments List
- Unpaid Bills
- Vendor Balance Detail
- Vendor Balance Summary
- Expenses by Vendor Summary
- Taxable Sales Detail
- Recent Automatic Transactions
- Recurring Template List
- Transaction Detail by Account
- Transaction List with Splits
The Essentials plan users can also take advantage of the Auto Sent Reports feature as well as Group reports.
Reports available on the Plus QuickBooks Online plan
Finally, being on the Plus plan means you can access quite a few more valuable reports. Everything from the lower plans is available and on top of that you’re getting:
- Budget Overview
- Budget vs. Accruals
- Custom Summary Report
- Profit and Loss by Class
- Profit and Loss by Location
- Total Deposits and Payments (Beta)
- Inventory Valuation Detail
- Inventory Valuation Summary
- Physical Inventory Worksheet
- Sales by Class Detail
- Sales by Class Summary
- Sales by Location Detail
- Sales by Location Summary
- Time Activities by Customer Detail
- Unbilled Time
- Invoice and Received Payments
- Uninvoiced charges
- Uninvoiced time
- 1099 contractor Balance Detail
- 1099 contractor Balance Summary
- Bills and applied payments
- 1099 Transactions detail report
- Open Purchase Order List
- Open Purchase Order Detail
- Purchases by Class Detail
- Purchases by Location Detail
- Purchases by Product/Service Detail
- Purchases by Vendor Detail
- Employee Contact List
- Recent/Edited Time Activities
- Time Activities by Employee Detail
- Balance Sheet comparison
- Location List
QuickBooks custom reports
Over 100+ reports on the Plus plan may sound like enough for one lifetime. Often, though, you may feel that they don’t describe things the way you’d like them to be presented.
For example, the Balance Sheet reports show by default the data for this year-to-date. You may be more interested in, for example, this quarter only and you’d like to compare it every time with the respective quarter last year.
How to customize reports in QuickBooks Online?
You can run some basic adjustments such as Report period, Display columns by, and others right from the report page. Select the desired values and click Run Report .
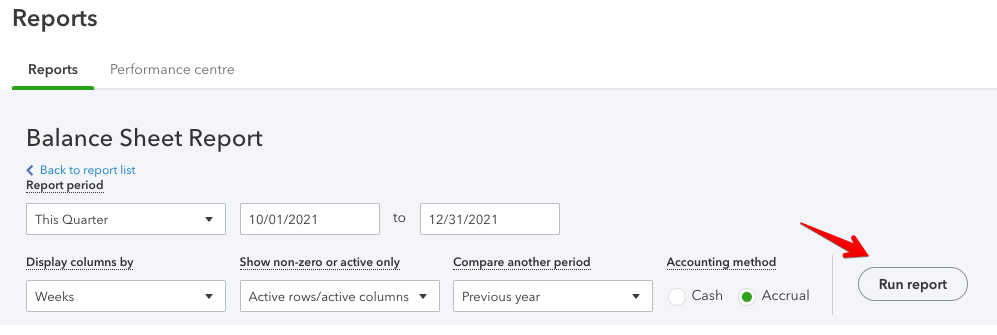
You can access a more detailed customization menu via the Customize button on the top-right side of the screen. The main differences are various formatting and filtering options available here.
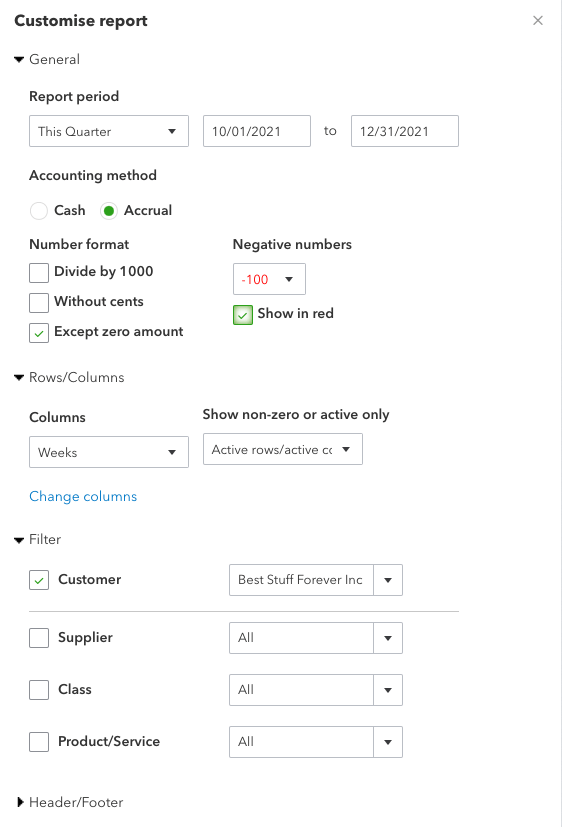
Don’t forget to click the Run report button underneath to reflect the changes.
How to create custom reports in QuickBooks Online?
If you regularly access a certain report and always need to make the same customizations, it would make more sense to save those changes for future use. You can do so by creating custom reports in QuickBooks Online.
Once you customized your report, click the Save customization button. Enter the report name. Optionally, you can group it with other custom reports or even share it with the community. Afterward, click Save .
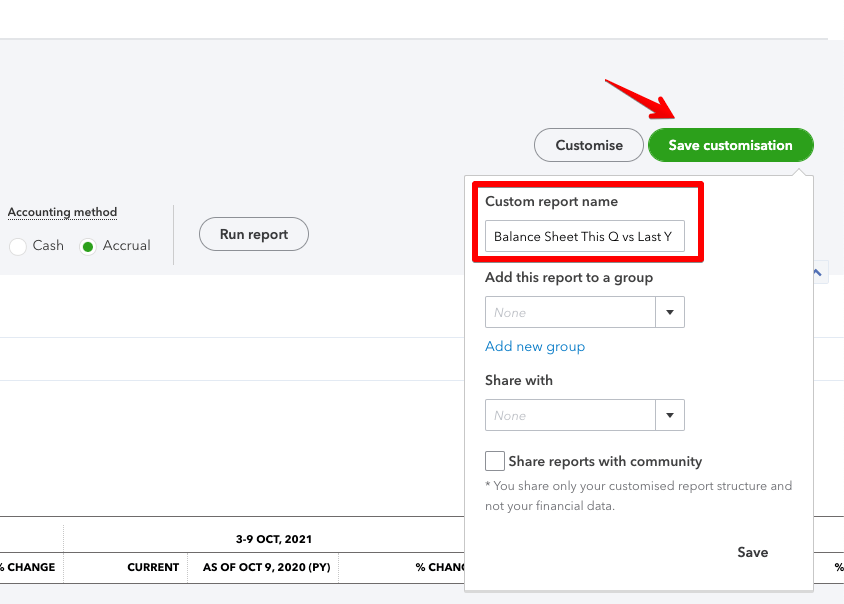
This flow is the same for all custom reports in QuickBooks Online.
Where can you view custom reports in QuickBooks Online?
Go to the Reports menu and select the Custom reports tab. Here you will see all the custom reports in QuickBooks Online saved by users of your account.

How to share custom reports in QuickBooks Online
When you create custom QuickBooks reports, you can choose to share them with your teammates or even with a community.

However, if you need to share QuickBooks custom reports externally, the easiest way to do this is to export them. QuickBooks Online allows you to manually export reports as PDF or Excel. For this, go to the list of your QuickBooks custom reports and select the drop-down menu next to the Edit button.
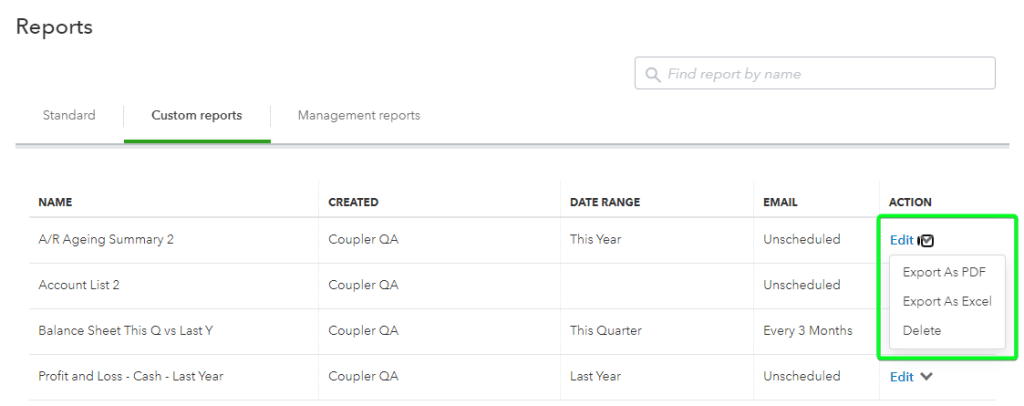
At the same time, you can optimize sharing of your reports if you automate their exports on a schedule using Coupler.io. This way, you won’t have to manually export data every time you need to refresh it.
You can schedule exports, say every day or every hour, to Google Sheets or Excel and share this spreadsheet with your stakeholders. We’ve explained the details in the section about QuickBooks automated reports .
Scheduled reports in QuickBooks Online
You can save each report in QuickBooks Online manually from its individual page. It’s a bit limited, as only Excel (.xlsx) and .pdf formats are available. Worst of all, you need to do it manually, which can be pretty inconvenient if you need to fetch a number of reports regularly.
Users on the Essentials and Plus plans can take advantage of the Auto Send Reports feature. In a nutshell, it allows you to send an email with a chosen report to a specific email address, at a chosen interval.
You can use this feature only with custom reports, but if you want to automatically send any of the standard reports, you can just save them as custom reports, the same as we did in the previous chapter. You don’t even need to make any adjustments.
Once you’ve created the desired custom reports, go to their list and click Edit to the right of the reports.
Toggle Set email schedule on. Then, choose when the emails should be sent and to whom. Use the default template or configure your own. You may also choose to attach the report as an Excel file, kind of QuickBooks export to Excel . Otherwise, the report will be sent in HTML format by default.
Once finished, click Save and close in the bottom-right corner.

How to schedule quarterly reports in QuickBooks Online?
It’s perhaps a bit counterintuitive but you can also send quarterly QuickBooks Online reports from the very same menu.
In the Set Recurrence section select:
- Repeats – Monthly
- Every – 3 months

Chances are, though, that the QuickBooks way of report scheduling won’t quite work for you.
Indeed, many accountants prefer to work with financial data from the comfort of a spreadsheet. This way, they can format it to their liking, run advanced formulas or even export the numbers into external services – for example, data visualization tools.
Although QuickBooks Online can be set to send Excel reports, it kind of goes against the purpose of an online platform, as the file still must be saved to a local drive.
Users of Google Sheets are also at a disadvantage as the process of importing .xlsx files into Drive is clunky and time-consuming.
Luckily, there’s another way to automatically export QuickBooks reports – a method as simple to set up but far more powerful.
QuickBooks automated reports to your favorite spreadsheet tool
If you’re planning to work with your data and generate reports from your favorite spreadsheet tool, Coupler.io is a much better solution.
Coupler.io can run automated data imports from QuickBooks to Google Sheets , MS Excel, as well as QuickBooks to BigQuery . The data can be synced as often as every 15 minutes and you can easily customize a schedule that works for you.
Learn how to set it up with our guide to exporting data from QuickBooks Online .
Coupler.io can import the following reports:
- Account List Detailed
- AP Ageing Detail
- AP Ageing Summary
- AR Ageing Detail
- AR Ageing Summary
- Customer Balance
- Customer Income
- Expenses by Vendor
- General Ledger Detail
- Journal Report
- Profit And Loss Summary
- Profit And Loss Detail
- Sales by Customer
- Sales by Department
- Sales by Product
- Tax Summary
- Transaction List
- Vendor Balance
Read our blog post to learn how to export check register from QuickBooks Online.
You can also approach it from a different angle and fetch the data about a specific data entity. The available options include:
- Bill Payment
- Company Info
- Credit Memo
- Exchange Rate
- Invoice Item
- Journal Entry
- Journal Code
- Payment Method
- Preferences
- Purchase Order
- Refund Receipt
- Sales Receipt
- Time Activity
- Vendor Credit
The guide on how to export chart of accounts in QuickBooks is also available on our blog.
The reports are available via the QuickBooks Reports source while the entities come with the QuickBooks source.

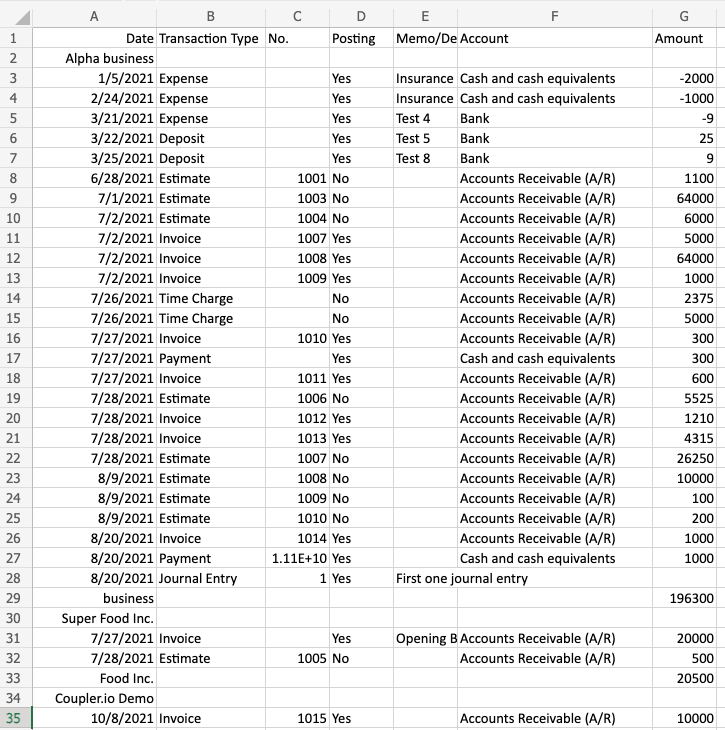
And here’s a sample export of a Transaction List by Customer report exported to Microsoft Excel:
How to automate QuickBooks reports export
We’ve blogged about how you can automate QuickBooks reports to Google Sheets in our guide to exporting data from QuickBooks Online . But here is a TLDR version of it:
- Sign up to Coupler.io , click Add importer and select your source app, Quickbooks Reports, and a destination app.
If you are going to create and automate a custom report in your spreadsheet, then you can choose QuickBooks as a source. This will let you export raw data from QuickBooks rather than data organized in the premade QuickBooks report.
- Connect to your QuickBooks account and select the report you want to export.
- Connect to your destination app account and select the file or table (for BigQuery) where to load your QuickBooks report.
- Schedule the automatic data refresh for your report and click Save and Run .
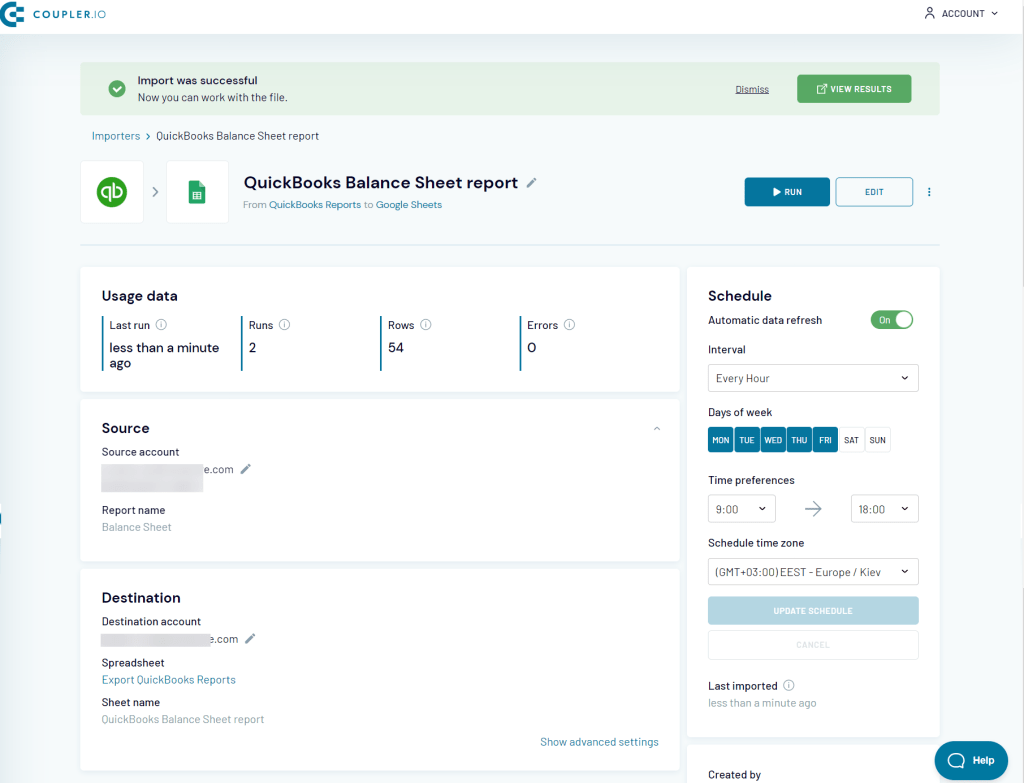
Here is what the integration may look like:
Can you export custom QuickBooks reports with Coupler.io?
With Coupler.io you can automate the export of reports and raw data from Quickbooks. This means you can customize your reports right in your spreadsheet. However, you can’t export the reports customized in QuickBooks.
Types of QuickBooks Online Reports
There are many different types of reports available in your QuickBooks account. We’ll now explain where to find the ones you’re interested in the most. We’ll also touch on how to export them with the method of your choice.
Standard payroll reports in QuickBooks Online

There are 19 reports available in the Payroll category, right at the bottom of the Reports page. Those of you on Smart Start and Essentials plans can access nearly all of them without any restrictions.
The exceptions are Payroll Summary by Employee , Recent/Edited Time Activities , and Time Activities by Employee Detail which are available only to Plus users.
Quarterly payroll reports in QuickBooks Online
To view a quarterly payroll report, open any of the reports in the category. Once there, adjust the time period to, for example, Last Quarter and press the Run report button.
If you’d like to save it for future use, click the Save customization button and name the report. From now on it will appear in the Custom reports section and will always include the data for the chosen period.

If you’d like to email it to yourself or someone else, follow the steps to schedule a quarterly report that we described earlier .
How to export employee reports in QuickBooks Online?
Employee Details and Employee Directory reports are available on every plan. You can fetch them in the standard way as Excel or PDF files and then save them on your device.
Depending on your needs, a direct export into a spreadsheet may prove to be more useful – especially if you plan to work with this data further. This can be automated with Coupler.io and the list of employees can be refreshed frequently, reflecting any changes you make on QuickBooks Online.
Here’s how to export employee data from QuickBooks Online.
A sample export looks like this:

How to export productivity reports in QuickBooks Online?
Although there’s no productivity report available in QuickBooks Online per se, the Time Activities by Employee Detail report is probably the closest thing you’ll find. You’ll find it in the Payroll section of the Reports page.
You can adjust it to some extent, save it as a custom report or schedule recurring reports to be sent to any email address.

An interesting thing to do would be pulling all time entries available with Coupler.io and building a productivity report in your spreadsheet. With a bit of time at your disposal, you could also export the data into a tool like Data Studio and build a wonderful, self-updating productivity report there.
Here’s how to get QuickBooks Online time data .
Budget reports in QuickBooks Online
There are two budget reports available in QuickBooks Online, both nested under the Business Overview category. These are Budget Overview and Budget vs Actuals . They’re only available on the Plus plan.

The icon for saving either report isn’t available at first because of the sheer number of columns the reports contain. Scroll a bit to the right and you’ll find the icon.
Budget from QuickBooks Online can also be fetched into a spreadsheet with Coupler.io. Here’s a sample export:

Accountant reports in QuickBooks Online
There’s a long list of reports available in the For my accountant section, the exact set depends on your plan.
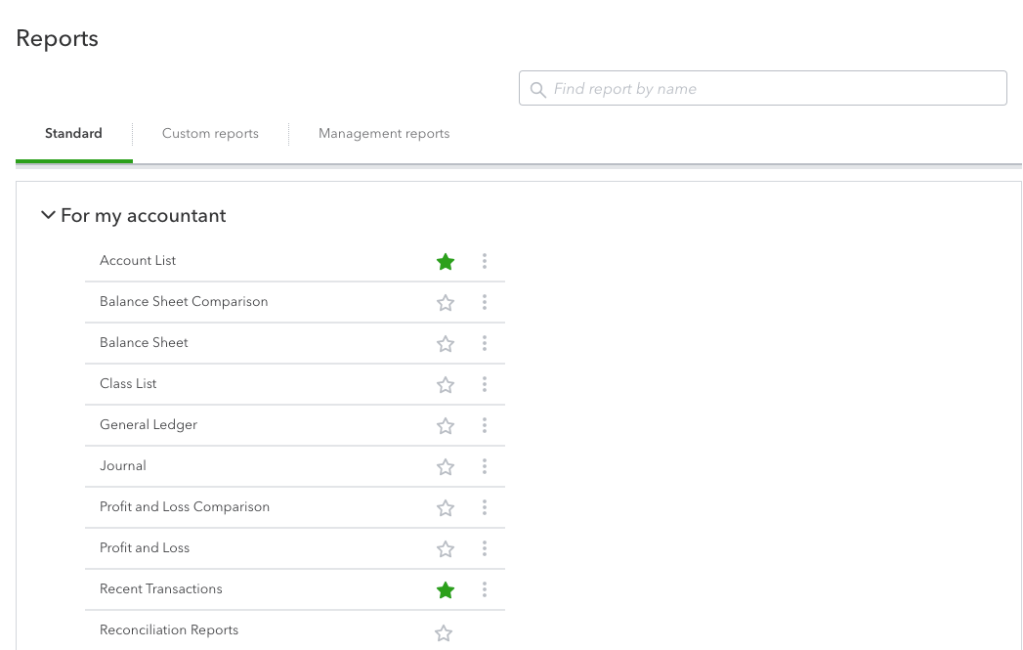
The majority of reports are available for all plans. The following are only accessible on Essentials and higher plans:
What’s more, Plus members can also access:
Each report can be saved in the standard way, as an Excel file or PDF.
Accountant automatic reports in QuickBooks Online
Accountant reports are something you may often want to export out of the platform – for further processing or to keep in your records.
This dull process can be automated with QuickBooks Online. Each report can be sent to a specific email address at a certain scheduled interval. Refer to the Schedule reports in the QuickBooks Online section for details on how to set it up.
If you plan to work further with any of these reports, exporting them directly into Excel or, for example, Google Sheets is probably a better idea. The advantage is that the data will be fetched into a typical spreadsheet format that allows for it to be formatted, put into formulas, or processed in any other way.
Most standard accounting reports are also available for the Coupler.io export. These include Balance Sheet , Cash Flow , Journal or Transaction List . Refer to the earlier chapters for instructions on how to set these up.
Vendor reports in QuickBooks Online
Vendor reports are nested in two separate sections in the Reports menu – What you owe as well as Expenses and suppliers . QuickBooks uses the terms “Vendor” and “Supplier” interchangeably so Vendor reports are referred to on the platform as Supplier reports.
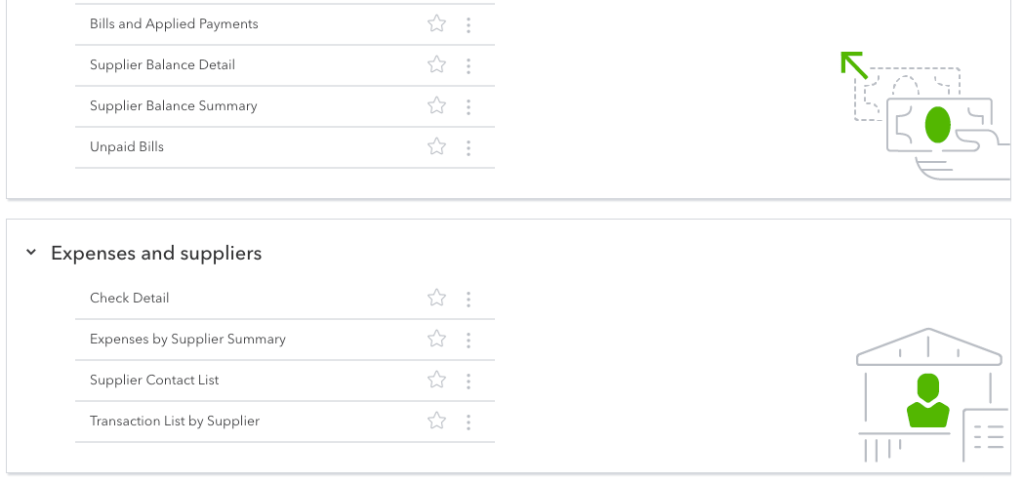
There’s a very limited number of supplier reports available on the Smart Start plan, Check Detail , Transaction List by Supplier and Supplier Contact List being the only ones you can access.
Users on the Essentials plan get quite a few other reports, including Vendor Balance Detail and Summary . The Plus plan comes with about a dozen additional reports.
Plenty of information about vendors can be fetched with Coupler.io. You can pull either raw vendor data or different vendor reports, right into your spreadsheet.
Expense reports in QuickBooks Online
Expense reports are grouped with vendor (supplier) reports as we discussed in the earlier chapter. There’s a very limited set of reports on Smart Start and Essentials plans while the Plus users can enjoy all expense reports. This includes:
- Purchases by Product Service/Detail
With Coupler.io you can import the Expenses by Vendor report, regardless of your plan.
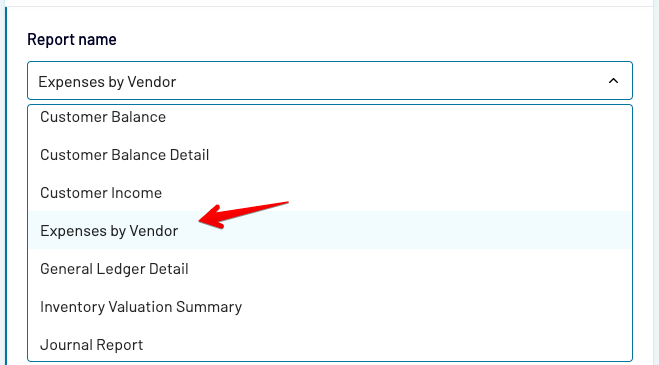
How to view reconciliation reports in QuickBooks Online?
You’ll find reconciliation reports in the For my accountant section of Reports . It’s easy to distinguish as it’s the only report on the list that doesn’t have a three-dots menu to the right, meaning it cannot be customized.
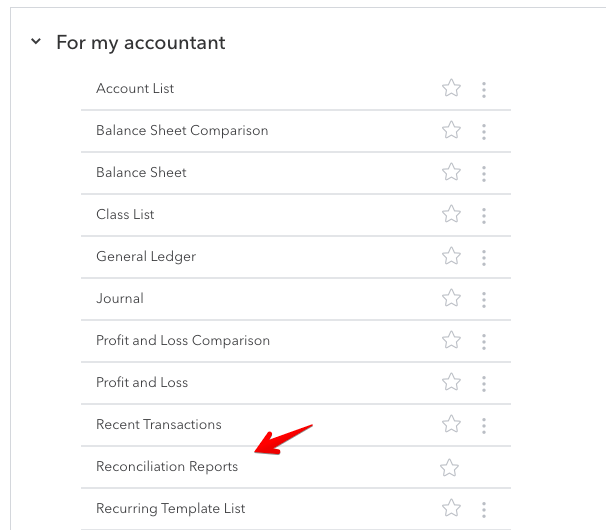
You can also view reconciliation details via the Accounting -> Reconcile menu.
Reconciliation reports are available on all QuickBooks plans.
Sales reports in QuickBooks Online
There are nine sales reports available in QuickBooks Online.
- Smart Start users only have one available – Sales by Customer Summary.
- Essentials users have additional access to Sales by Customer Detail and by Customer Type Detail . What’s more, they can also view Sales by Product/Service Detail and Summary .
- Plus members get all the reports, including some QuickBooks Online Class reports – Sales by Class Detail, by Class Summary as well as by Location Detail and by Location Summary .
You can find the available reports under the Sales and Customers category.

Can I create an MRR report in QuickBooks Online?
QuickBooks Online doesn’t feature any MRR or ARR reports. At the same time, it doesn’t seem possible to even estimate either metric based on the data available in QBO.
You could technically pull your revenue numbers and split them into months in a spreadsheet. Based on that, it would seem that you can calculate the recurring revenue. BUT… it’s not that simple.
QuickBooks Online (or any accounting software for that matter) doesn’t differentiate between new revenues and those coming from renewals. They also fail to notice deals that were not renewed for another period, skewing the MRR stats in the process.
As such, calculating MRR based on QBO revenues is more like calculating an average monthly revenue over a certain period, rather than an actual MRR metric.
There are plenty of tools, though, that can be plugged into your product and can pull the vital metrics from there. It’s a far more reliable approach than trying to make something out of QuickBooks Online reports.
Inventory reports in QuickBooks Online
There are two inventory reports: Inventory Valuation Detail and Inventory Valuation Summary , both sitting under the Sales and customers category. Both are available only to Plus members.
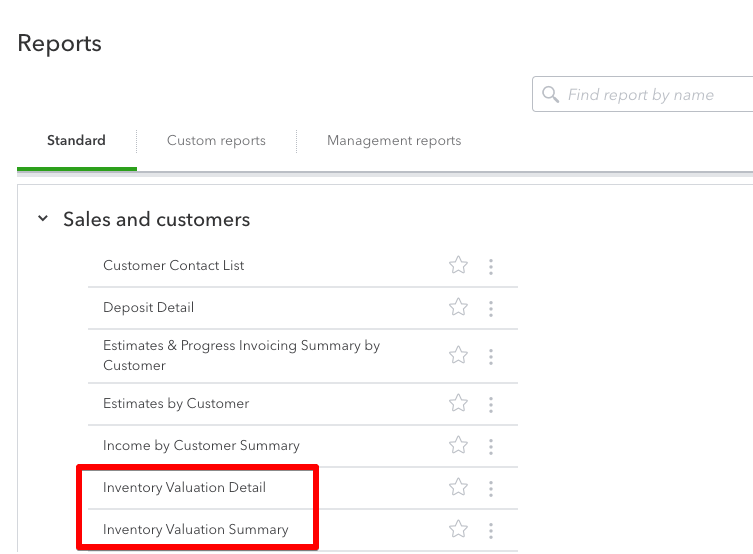
Coupler.io also features an option of pulling the Inventory Valuation Summary report into a spreadsheet.
Job cost reports in QuickBooks Online
The job cost report in QuickBooks Online is referred to as Time cost by employee or supplier . Also, it’s a bit hidden for some reason.
Rather than going to the usual Reports tab, head to Projects instead. You’ll need to have projects enabled on your QuickBooks account for this tab to show up.
While in there, click on the project you’re interested in and then Project Reports .

Then, select the Time cost by employee or supplier report for this project and you’ll see the desired report.
While in there, you can also access other project reports in QuickBooks Online – Project profitability and Unbilled time and expenses.
Reports by class in QuickBooks Online
There are a number of reports where the data can be differentiated by class. These are:
The reports are only available for Plus users. What’s more, they can also access a separate Class List report.
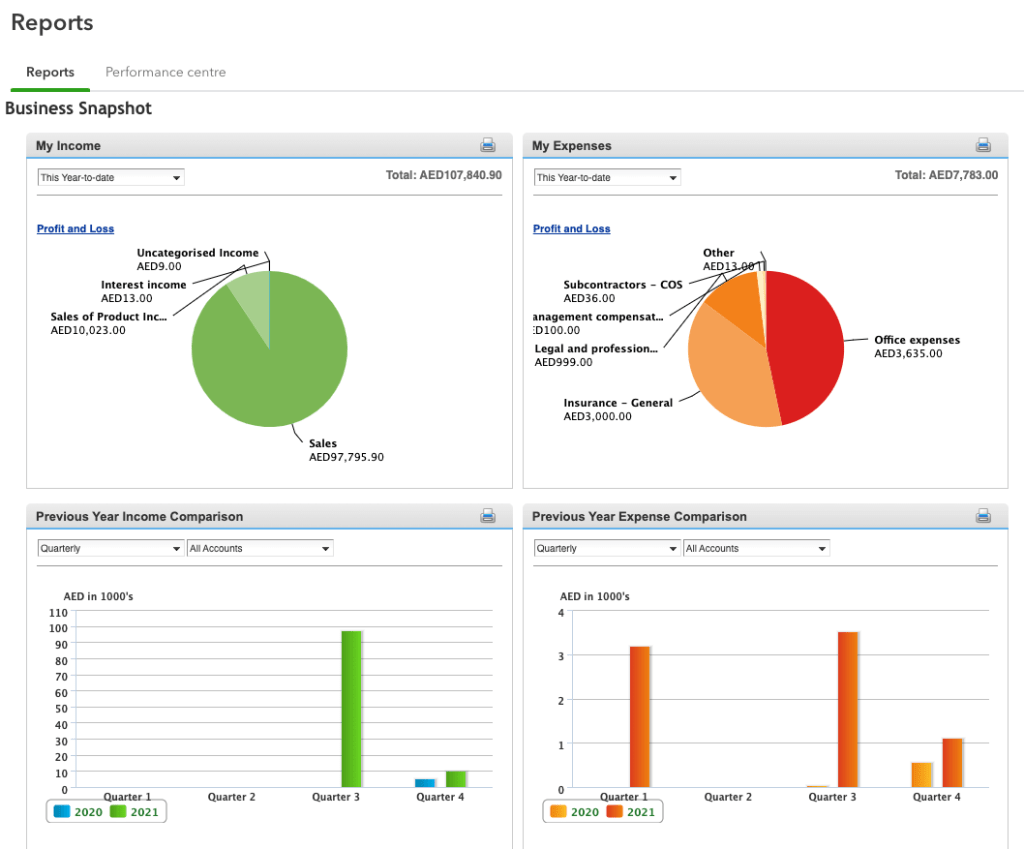
How to see graph reports in QuickBooks Online?
If you’d like to see a more visual report, you certainly need to check out the Business Snapshot report. You’ll find it in the usual Reports menu, under Business Overview .
Management reports in QuickBooks Online
Management reports are more of a feature than a new type of report. Basically, it allows you to format any of the existing reports into a good-looking PDF template, with a cover page, executive summary, and other beautiful components. You can also add notes to the file.
When you first enter the Management reports tab you’ll see just two default reports – Basic Company Financials and Extended Company Financials . We’ll now show you how to create a new one.
How to create a new management report in QuickBooks Online?
First of all, decide on the report you’d like to use as a management report. You can use any of the existing reports but if you plan to make any adjustments to it, you will first need to save it as a custom report.
- Same as we did earlier in this article, open the report and make the necessary changes. Click Save customization , give the report a unique name and save. From now on, it will appear in the Custom reports section.
- Go to the Management reports tab. Choose either a Basic or Extended type of report. Select the Report period and then click View -> Edit next to a chosen report.

- Next, choose Reports and then Add new report . Find the desired report on the dropdown list and adjust any details if needed.
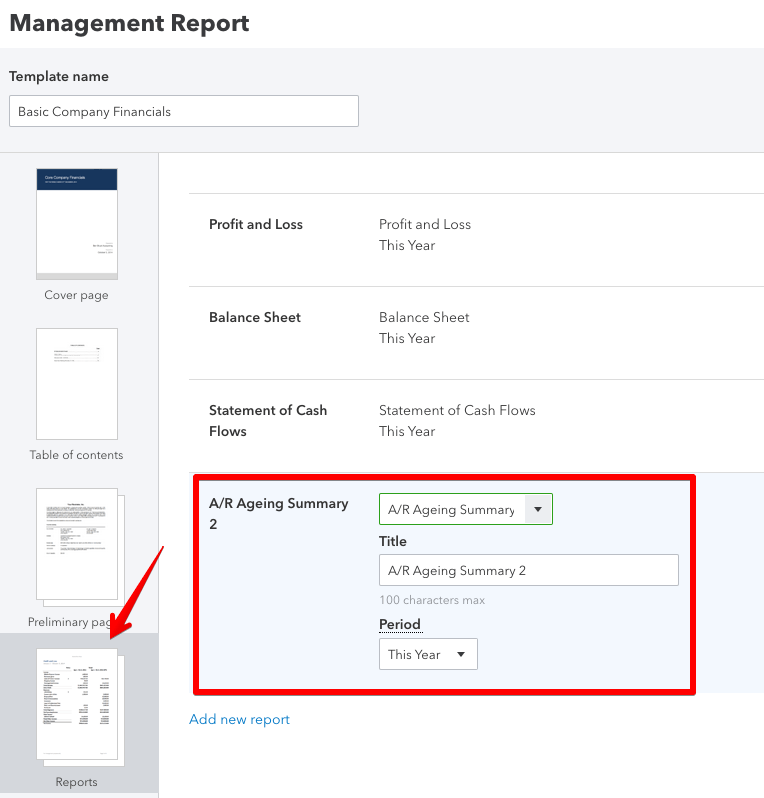
- Click the Save and Close button in the bottom-right corner.
- The report will now appear on the list. Click View to the right. A preview will appear which you can save as a PDF or print right away.

QuickBooks Online Reports – Summary
Even on the most basic QBO plan you have access to plenty of rich reports. They make it easy to report and analyze data at will, and if you’re missing something, chances are you can customize the existing reports and find the information you need.
If you prefer to work with your QuickBooks data from the comfort of a spreadsheet, consider exporting QuickBooks reports to Google Sheets instead. If you’re more into Excel, we’ve recently added it as a destination too.
Thanks for reading!
Technical Content Writer on Coupler.io who loves working with data, writing about it, and even producing videos about it. I’ve worked at startups and product companies, writing content for technical audiences of all sorts. You’ll often see me cycling🚴🏼♂️, backpacking around the world🌎, and playing heavy board games.
Comments are closed.
Get analysis-ready data to build insightful reports!
Take your data analytics to the next level
By signing up to Coupler.io, you agree to our Privacy Policy and Terms of Use .
Your guide to custom reports in QuickBooks Online

Let’s face it… reporting is the lifeblood of every business. From routine financial reporting to satisfying compliance requests – you’re constantly faced with the need to extract and review your key accounting data . While necessary, this is a task that can take up vast amounts of your time.
Custom reports, on the other hand, are a way to make sure you get the data you need as quickly as possible. Plus, based on our firsthand experience, they’ll directly aid you in setting up a proper vendor workflow in QuickBooks Online for fast insights and analysis.
The QuickBooks knowledge base is filled with lots of questions about QuickBooks’ customized reports, so here’s an overview of what’s possible (and not possible) for custom reports in QuickBooks Online (referred to as QBO, moving forward, for the sake of brevity).
The different “flavors” of custom reports in QuickBooks Online
In the Reports section of your QuickBooks Online Dashboard, you’ll see that reporting is divided into three general categories:
- Standard: The library of default reports available in QuickBooks Online, which are pre-populated with your data and ready to go! This is where you’ll find the typical financial reports you’ll need to run.
- Custom Reports: A list of reports that you (or your team) have customized and saved.
- Management Reports : Groups of reports that have a cover page, table of contents, and space for opening commentary and endnotes. There are 3 predefined management report templates in QBO. These are useful for any time that you need to dress up your reports for a specific audience.
Overall, our findings show that there are four basic types of reports available:
- Transaction reports , which group transactional information in a variety of ways. This is the home of bread-and-butter reports like your P&L and Balance Sheet.
- List reports , where you’ll find information on your Chart of Accounts, Products/Services list, Customer and Supplier lists. These are perfect if, for example, you’re looking for how to get a list of checks written in QuickBooks.
- Summary and Detail reports which, as their name implies, provide different rollups of the information contained within each report type.
It’s important to understand the basics of how reports are assembled in QBO, as they are the building blocks for any custom reporting you’d like to do.
What’s possible with custom reports in QuickBooks Online
Custom reports in QuickBooks Online do offer users a level of control, but based on our observations, these custom reports are essentially tweaks on the standard reports included out of the box.
But as per our expertise, they certainly have their pros.
Many people will ask something like, “Which feature in QuickBooks Online reports allows customization of section headings on the profit and loss and balance sheet reports?” These individuals have clearly never heard of custom reports, because that’s exactly where they shine.
In QuickBooks Online, a custom report allows you to:
- Personalize the report title and header information
- Set a reporting period, and formatting of numbers
- Add, remove, and re-order the columns associated with that report
- Apply report-level filters
The key piece to note here is that, in every case, you need to start with a standard report as the foundation of your custom report.
Questions are often posted to the help center around what’s possible with a custom report, and how to share custom reports in QuickBooks Online.
I’ve distilled their feedback down to the following – a custom report in QuickBooks Online:
- Cannot combine data from different report types
- Must use the same look and feel of the report it’s built off of
- Can only leverage data available in QBO
So, if you were wondering which form cannot be customized in QuickBooks, it’s any form that requires you to do any of the above.
Drawing from our experience, custom reports can also sometimes have mishaps, such as QuickBooks custom fields not showing in reports for some users.
Here’s another example of how custom reports can be tricky – let’s imagine you’re in this scenario: Your client wants a customized report to track delinquent customer accounts. After customizing a report, you should do which of the following to save the customized report?
- Save Settings
- Save Customizations
The correct answer is D, but all these options seem viable, right? Reasons like this are why learning to use custom reports can be a bit of a learning curve.
In sum, our investigation demonstrated that custom reports in Quickbooks Online are a great starting point, but you’ll inevitably find yourself in a scenario where you wish they could do a bit more. With that in mind, here are a few alternative approaches to consider.
Alternative #1: Spreadsheets
If you’ve found that you’ve hit a wall with the custom reports in QuickBooks Online, it may be time to consider extracting the data and manipulating it in Google Sheets or Excel.
Our research indicates that as long as your exports include a unique identifier like a reference number or client ID, you’ll be able to combine data from different reports using the vlookup() formula.
Here’s an overview of the steps involved:
- Export the data you want to compile into a report (make sure you have a column you can match the data together with!)
- Import each data set as a unique worksheet in your spreadsheet.
- Decide on the final format. You’ll need to a) add columns to one of the reports to handle the matched data, or b) create a new spreadsheet with the relevant columns you’d like to combine.
- Use the vlookup() formula to extract data from one sheet and populate it into the final destination. Don’t forget to double-check your formulas…this is one of those formulas that can be a bit finicky when pasted across cells incorrectly! Here are some great videos outlining how to use vlookup in Excel and Google Sheets !
After putting it to the test, the beauty of this approach is that you can combine data however you want. Better yet, it gives you the ability to bring in external data sets and match them against your QBO data.
The downside is that this is quite manual and prone to human error due to the setup of the worksheets and formulas.
Alternative #2: The Method way
You might be thinking, “I can’t figure out QuickBooks is there another option for me?”
If so, you’re not alone – Method doesn’t just expand your possibilities with QuickBooks. It also strives to make your QuickBooks experience as digestible as possible.
Reporting is a big deal to our customers here at Method, and I love the functionality our teams have built around the Report Editor .
One of our guiding principles here is to enable businesses to do more with QuickBooks, so we built our CRM reporting capabilities specifically to address the limitations of custom reports within QuickBooks Online.
Using Method’s reporting tools, you’ll be able to:
- Merge and combine all types of data into single reports (including both transaction and non-transaction data)
- Create beautiful reports using our drag-and-drop interface
- Leverage this powerful customization engine to tailor any document you can imagine, including QuickBooks invoices and estimates !
Because Method syncs all your QuickBooks data in real-time, you get live reporting without the limitations discussed above!
Wrap up: Custom reporting in QuickBooks Online
The built-in reporting capabilities in QuickBooks get any business off to a great start and do an amazing job of handling the “bread and butter” reports you’ll need regularly like your:
- Profit and loss statement
- Balance sheet
As you find yourself needing a bit more than the standard “custom” reporting capabilities provide, take a quick minute to celebrate – it’s a sign that your business is growing!
As discussed today, there are both short-term “stop-gap” solutions that can help and a great long-term solution that will help you take your growth to the next level (in reporting and beyond!).
Learn how else you can extend the power of QuickBooks Online with Method in this free ebook .
About The Author
Eilis McCann
Related posts.

How to create an invoice in QuickBooks

3 ways you win with QuickBooks mobile access
Streamline your business with method.
Start your free trial — no credit card, no contract.
QuickBooks Online Management Reports: A Feature You Should Use

Serving over 4 million customers worldwide, QuickBooks Online is one of the leading accounting solutions used by small businesses today. However, most of these companies rely on the “core” functionality and rarely take a close look at the advanced features. For example, one such tool is Management Reports. Read on, and in this article, you will learn how you can take advantage of this tool and why you should do so.
What Are Management Reports?
Upon hearing the term “Management Reports,” many immediately conclude these are reports that are operational in nature, such as sales reports, accounts receivable and accounts payable aging reports, and profitability margin by item reports. QuickBooks Online Management Reports could potentially include statements such as those mentioned. However, they are far more reaching in scope.
To clarify, Management Reports are “books” of user-defined, presentation-quality, customized reports. For example, these reports can contain cover pages, tables of contents, financial statements, operational information, compilation reports, and even management discussion and analysis commentaries. You can use any of the three pre-built Management Reports available in QuickBooks Online, or you can customize them to meet your needs and save them for future use. Further, you can distribute your management reports directly from within QuickBooks Online, save them as PDFs, or export them as Word documents for further editing.
Accessing QuickBooks Online Management Reports
To use the Management Reports feature in QuickBooks Online, click Reports in the left menu, followed by the Management Reports tab. There you will see three pre-defined sets of Management Reports you can use as-is or customize them. Next, clicking View on the Company Overview report allows you to examine this report’s content, as pictured in Figure 1 .

If the report is suitable, can click Send , Export as PDF , or Export as DOCX in the Action column’s drop-down list. Then you can send it via email, export it to a PDF file or DOCX file, or share it using other means.
Customizing Your Management Report In QuickBooks Online
If you need to customize your Management Report, click Edit in the Action column’s drop-down list. Subsequently, the dialog box pictured in Figure 2 opens. Here you can perform the following customizations.
- Change the Template’s name ,
- Edit the Cover Page’s style ,
- Add a logo ,
- Change the Title and Subtitle ,
- Edit the Report Period ,
- Add Prepared by and Prepared date fields ,
- Add or edit Preliminary pages ,
- Add other Reporting objects , and
- Add or edit End notes .

Upon completing your edits, click Save and Close in the lower right corner. Subsequently you can distribute the report using any of the techniques described previously. Of course, having saved the report, you can use it again in future periods, and all your customizations will appear automatically, saving you the time you would otherwise spend customizing that period’s reports.
In conclusion, many QuickBooks Online users fall victim to the notion that they cannot customize their reports when they can. Importantly, the Management Reports feature provides you with a robust set of tools to create a comprehensive report book. Further, you can customize Management Reports to meet your company’s financial and operational reporting needs or those of a client. Therefore, if you use QuickBooks Online, be sure to check out this excellent feature today.
Check Out These QuickBooks-Related Seminar From K2 Enterprises
Eight-Hour Session
- K2’s QuickBooks for Accountants
Four-Hour Sessions
- K2’s Advanced QuickBooks Tips and Techniques
- K2’s Implementing Internal Controls in QuickBooks Environments
Check Out These QuickBooks-Related On-Line Options From K2 Enterprises
Web-based Learning
- K2’s QuickBooks Online – What CPAs Need to Know
- K2’s QuickBooks Online – Tips and Tricks
Check Out This Video Showing How You Can Use The Management Reporter
Tommy Stephens
Related posts.

Details Emerge About QuickBooks Online Bill Payment Options

Enabling Automated Workflows In QuickBooks Online Advanced
Top 25 Management Reporting Best Practices To Create Effective Reports
Table of Contents
1) What Is A Management Report?
2) Financial vs. Management Reports
3) Management Reporting Best Practices & Examples
4) Management Reporting Trends & History
5) Importance Of Management Reporting
6) Types Of Management Reports
7) Management Reporting System Functionalities
8) Best Practices Summary
Management reporting is a source of business intelligence that helps business leaders make more accurate, data-driven decisions. But, these reports are only as useful as the work that goes into preparing and presenting them. In this blog post, we’re going to give a bit of background and context about performance management reports, and then we’ll outline 25 essential best practices you can use to be sure your reports are effective.
We’ll also examine examples that illustrate these practices in action created with modern online reporting tools . By the end of this article, making stunning and useful managerial reports will be second nature to you. But before we get into the nitty-gritty, let’s start with the basic definition.
What Is A Management Report?
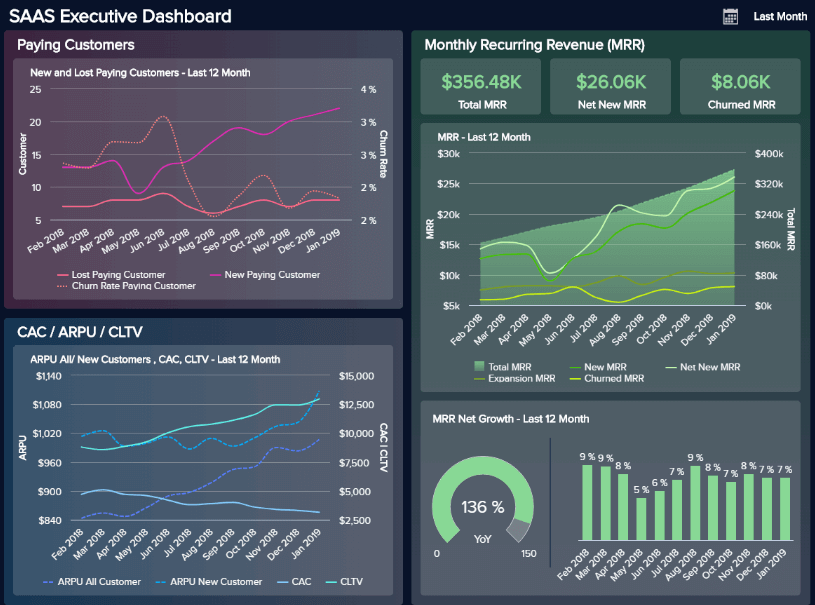
Management reports are analytical tools used by managers to inform the performance of the business in several areas and departments. Senior executives and leadership use management reporting to drive their strategic decisions and monitor critical KPIs in real-time.
They basically show the worth of your business over a specific time period by disclosing financial and operational information. Reporting for management provides insights into how the organization is doing, empowering decision-makers to find the right path to increase operating efficiency and make pertinent decisions to remain competitive. To do so, many companies use professional management reporting software .
Backed up with powerful visualizations developed with a dashboard creator , no information can stay hidden, eliminating thus the possibility of human errors and negative business impact. The image above is a management report example focusing on a SaaS business. Throughout this post, we will cover various examples for different industries and departments to help you understand the power of these modern tools.
In The Beginning, Financial Reports
Most people in business are familiar with financial reports, which your business is required to keep for external accounting purposes. These reports are generally put out “after the fact” and follow a very clear and established set of guidelines known as Generally Accepted Accounting Principles (GAAP).
While such reports are useful for legal purposes, they’re not ideal for decision-making. They give you a bird's eye view of your business operations but without the actionable insights that are useful for making strategic choices. They’re also slow. As Tyrone Cotie, treasurer of Clearwater Seafoods, said , “…no matter how quickly you compile and release historical financial statements, you never make a decision from them. The challenge for finance is getting timely and accurate analysis that’s forward-looking and helps us make decisions.” This statement is valid today and probably, in the future as well. Why?
Because this mismatch between usefulness and reality comes from the fact that financial reports were never designed to be useful: they were designed to satisfy legal requirements. They were using historical data only.
Trying to make financial management reports useful
The mentioned mismatch led some companies to try to use their financial reports for legal purposes as decision-making tools by including additional information in them. While this approach has some merit, it has one big drawback: increased complexity and time cost. Considering that financial reports have to hit specific legal deadlines and that any additional information will cause them to be prepared in a more time-intensive way, this approach of “hybridizing” financial reports into management + finances is not recommended. Thus, the practice of management reporting separately from financial reporting came about. Managerial reports use a lot of the same data as financial ones but are presented in a more useful way, for example, via interactive management dashboards .
As a Growthforce article states, management reports help answer some of the following questions for a CEO:
- “Am I pricing my jobs right?
- Who are my most profitable clients?
- Do I have enough cash for payroll?
- Should I hire more employees? If so, how much should I pay them?
- Where should I spend my marketing dollars?”
To answer these questions, you will need a financial management report focused not on legal requirements but on business-level and decision-making ones. In essence, analysis reports are a specific form of business intelligence that has been around for a while. However, using dashboards, big data, and predictive analytics is changing the face of this kind of reporting.
Before moving on to our list of best practices, we leave you an image to help you easily visualize the differences between these two types of reports.
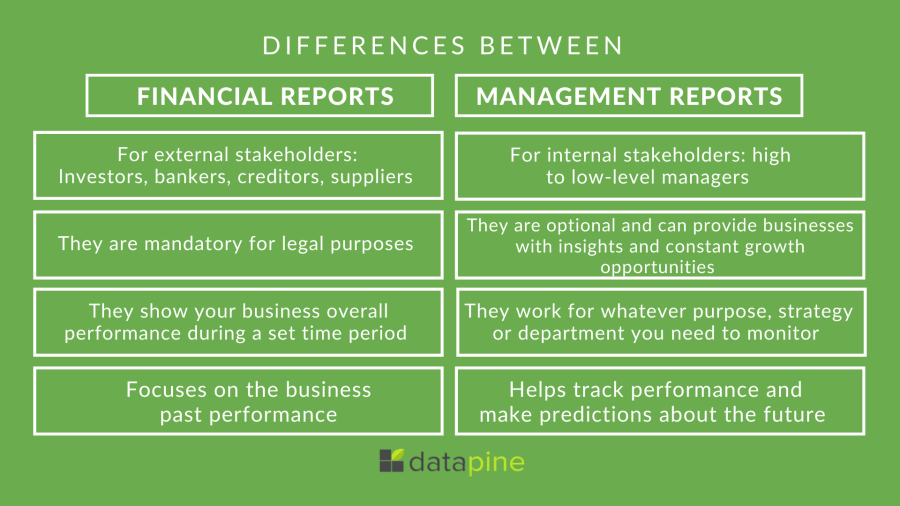
**click to enlarge**
What Should Be Included In A Management Report: Top 25 Best Practices, Examples & Templates
We’ve asked the question: ‘ What is a management report?’ and explored its clear-cut benefits. Now, it’s time to consider the management reporting best practices.
Here, we’ll explore 25 essential tips, looking at management reporting examples while considering how you can apply these principles to different types of managerial reports.
1) Set the strategic goals and objectives
For every report you write, you will need to start with the end in mind. Why do you need that report in the first place? Do you know the key drivers of your business? How can you tell if your pricing is correct? How do you define success? Ask yourself some important data analysis questions that will allow you to address the needs of the report.
Once you know what you are monitoring and why it will be much easier to set the performance indicators that will track each specific aspect of the performance, don’t go further in the reporting process until you have set at least two to three goals.
2) Gather and clean your data
After you’ve set strategic and operational goals for the organization, your next step is to collect the information needed to track the success and performance of your efforts toward achieving those goals. Now, an important point to consider here is to pick only the data that will assist you in tracking your goals. Businesses gather an infinite amount of information coming from customers, sales, marketing, and much more, and tracking everything can become overwhelming and counterproductive. Instead, pick the sources of data that you actually need and move on to the cleaning stage.
Once you have selected your sources, you must ensure your data is clean and ready to be analyzed. When we say clean your data, we mean erasing any duplicates, missing codes, or incorrectly formatted data that can damage your analysis in the future. If, just by reading this, you are thinking, “What a tedious process this must be,” it's because it is. Cleaning your data manually requires a lot of time and effort. That said, there are many online data analysis tools out there that automate this process to save you countless hours of work and prevent any risk of human error.
3) Pick the right KPIs for your audience
OK – so you know that you need to focus on a small number of KPIs. Which ones should you be putting on?
It really depends on your audience – both on their job function and their level of seniority. For example, a junior sales manager and a junior marketing manager are both going to want to see different indicators. And the junior marketing manager will be interested in different data than the head of marketing. Good KPI management is critical in the process of manager reporting. A good way to think about the challenge of picking the correct metrics is to think: what data-driven questions will the readers of this report want to be answered? A sales manager might be interested in which of his reps is performing better, while an inbound marketing manager might want to know which piece of content is performing better regarding new email signups. Only after answering this question you will be able to address your audience’s expectations and benefit from effective reporting. You can also read our KPI reports article, where you can find precious advice on how to pick your KPIs.
Hereafter is an investment management reporting format that illustrates this practice well. It focuses entirely on variables that investors would care about, including the share price and the price-to-earnings ratio.
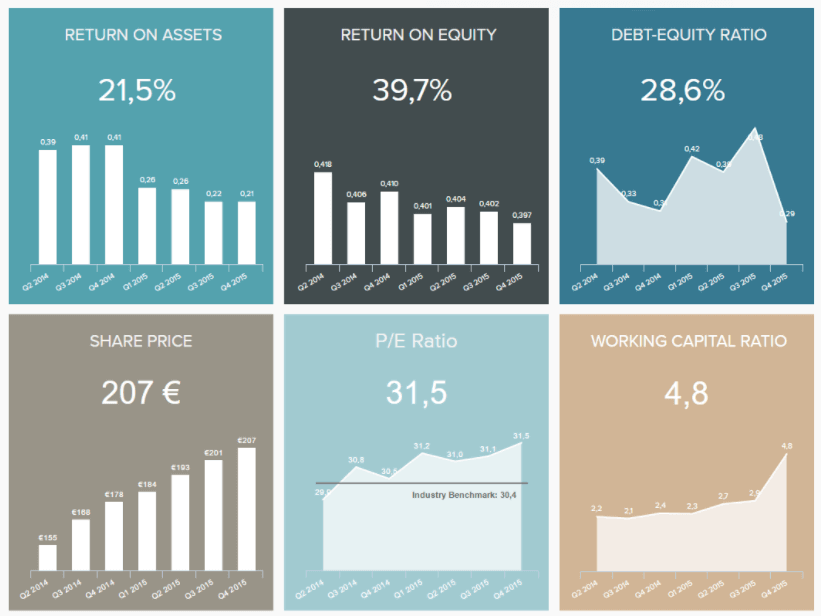
**click to enlarge**
4) Set measurable targets and benchmarks
Once you’ve set your goals and defined the KPIs you’ll need to measure them, it is a good practice to set targets or benchmarks to evaluate your progress based on specific values. Let’s explore some ways in which you can define them in the most efficient way possible.
To do so, you first need to understand the difference between targets and goals. On one hand, goals are general strategic objectives that your company wants to achieve, such as increasing revenue compared to the previous year. And on the other hand, targets are the measures that will enable you to understand if you are on the right track to achieving your initial goals. Based on that, you should be able to set measurable, relevant, and achievable targets. Emphasis on achievable. Many businesses make the mistake of setting unrealistic targets and end up being disappointed when they don’t reach them. To prevent that from happening, comparing your performance to the previous period is a good and realistic benchmark to get started. Our example below is a CEO dashboard that gives managers a perfect overview of the organization’s performance compared to the previous period. Let’s talk about it in more detail below.
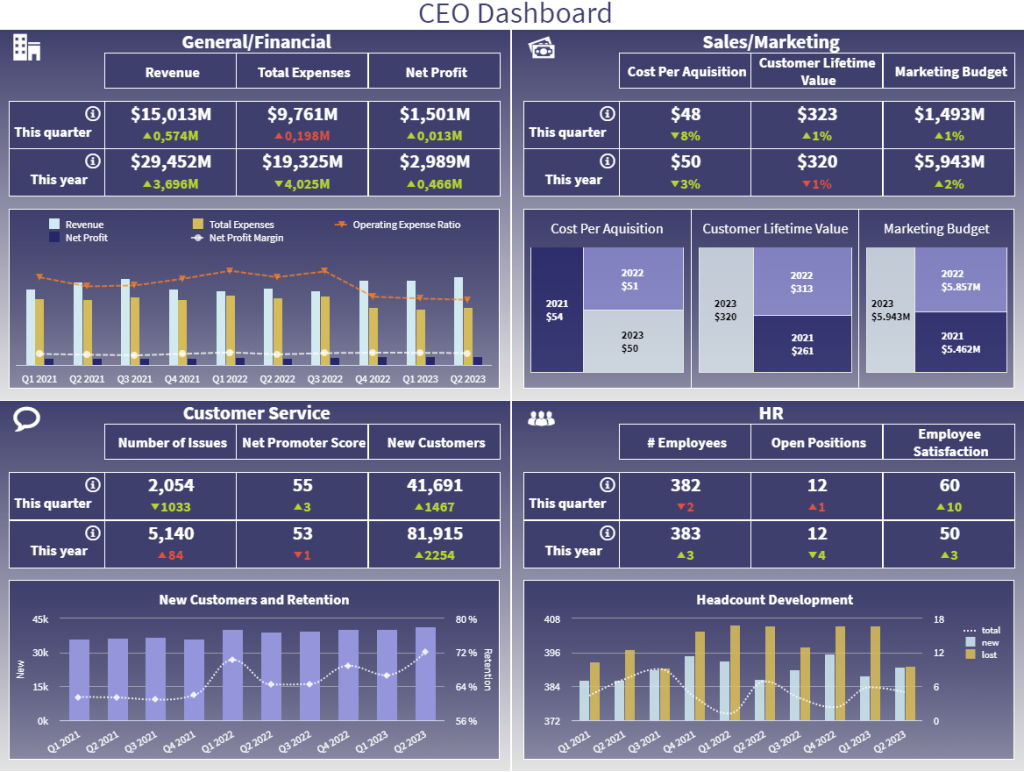
The CEO template provides insights into 4 critical areas for any C-level executive: finances, sales and marketing, customer service, and HR. Each of the metrics displayed in this report is compared to a benchmark of the previous period, with the colors red and green showing negative or positive development, respectively. Through this, managers can understand if their strategies are performing as expected and quickly spot any issues or improvement opportunities.
5) Take customer feedback into consideration in your reports
An additional tip is to use customer service analytics to draw conclusions from your client's feedback. Customer feedback plays into the overall performance of an organization as it caters to the organization’s ability to meet the needs of its customers. This feedback not only helps teams gauge what they’re doing wrong on their digital channels but also what they’re doing right .
Reporting on insights from feedback surveys can aid in forming a more data-driven digital strategy. For example, it can be leveraged to inform your product roadmap, identify pain points across the website (usability), and boost overall customer satisfaction.
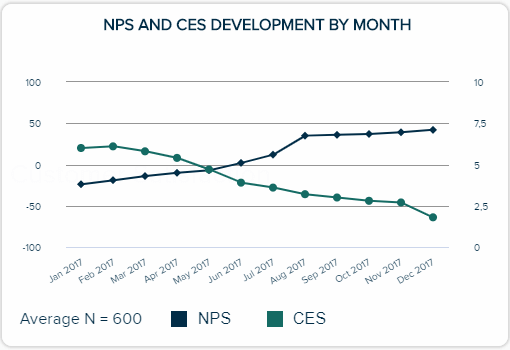
Is it overall customer satisfaction you wish to report on? Dive into your charts and show the rise (or fall) of your Net Promoter Score (NPS). Then take it one step further and analyze open comments associated with your scores to uncover what’s causing the drop. From here, you can formulate a strategy for boosting the organization’s NPS.
Here is an illustration of an NPS (feedback) chart:
6) Tell a story with your data
Our next tip zooms out of hard data and figures to focus more on the style and how to present your raw content. Human beings are primarily persuaded through 3 different types of information: context, content, and meaning. When you tell a story using the insights on your report, you can utilize all of them. This form of storytelling is challenging, but you have a few tools at your disposal and some tips:
- Using time periods and historical data. Stories follow a beginning, middle, and end pattern, and through the use of showing trends over time, you can achieve something similar. For example, you could compare the revenue in Q1 this year to the revenue in Q1 last year.
- Contrasting different KPIs and metrics against each other. For example, showing a target revenue number vs. the actual number this quarter.
Hereafter is a good example of a management report, mainly thanks to the three large historical graphs taking up most of the display:
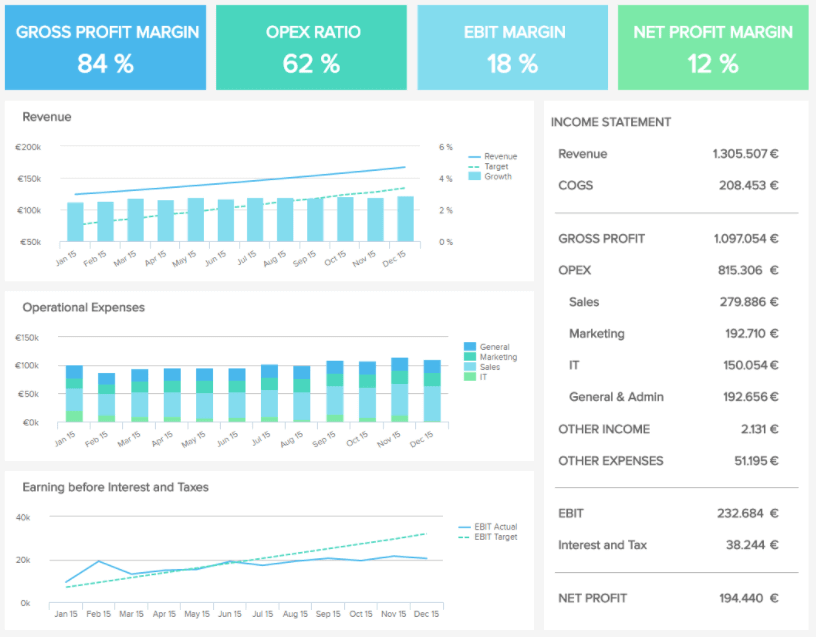
Let’s take a real-world example of how you can selectively use metrics to tell a specific story: you are the head of marketing and need to justify your current expenditures on content marketing to the CEO. She doesn’t care about email signups or page visits. No, your CEO is interested in revenue and ROI (an essential element of any effective financial management report). It is your job to connect the KPIs you look at revenue so that your CEO understands how important funding your department is.
You could show her the following variables to tell a story:
- Current email list numbers compared to last quarter
- How many new email list signups you’re currently getting per week on average
- The average email list signups you got per week last quarter
- How much money are you making, on average, for every new email subscriber and calculate the expected ROI
Using all of this information, you can answer the following question: how much new revenue is being driven by your new content marketing strategy?
This is the kind of story that can make or break funding allocation for a department.
7) Pick the right visuals
If you ever dealt with analytics and reporting before, then you must be aware of the multiple types of graphs and charts available to visualize your most important KPIs and build your reports. That said, being aware that these graphics exist does not mean you have the knowledge of how to use them correctly. A common mistake when it comes to management reporting is to use the wrong visual. This can significantly harm the decision-making process as the data can be perceived in the wrong way.
The first step you should take to avoid this mistake is to think about the goal of the data you want to display. Are you trying to show the breakdown of total costs? Or comparing costs to a previous period? Understanding the end goal will enable you to pick the right visual to convey the information you want. To help you with this task, below we display a visual overview of the different types of graphs and charts you should use depending on whether you want to compare, find relationships, analyze distribution, or composition.
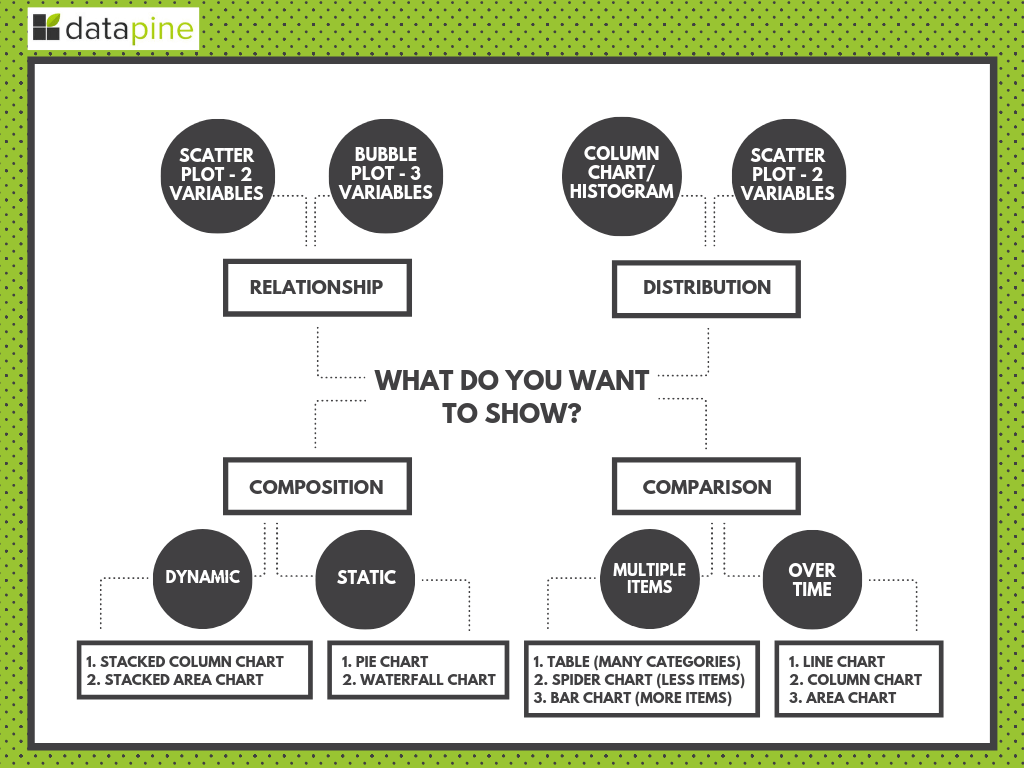
If you want to dive deeper into this topic, our guide on the different types of graphs and charts will provide all the necessary knowledge and practical examples.
8) Make your report visually pleasing through focus
The human mind cannot process too much data at a time without getting overwhelmed. Getting overwhelmed leads to decision fatigue – which makes it harder for your management team to think strategically. That’s why when it comes to this level of reporting, you should remember the mantra of “less is more.” As a rough rule of thumb, displaying three to six KPIs on a report is a good range, and going too much beyond this is not the greatest idea.
That doesn’t mean that you can’t have other data presented – but you must have a clear hierarchy of visual importance in your report and only give the most important spots to your indicators. Other metrics should occupy secondary or tertiary positions. State-of-the-art online dashboard software allows you to easily build interactive KPI dashboards in no time that will become your prime asset when you’ll need to convey your information.
The following example is good to showcase this practice:
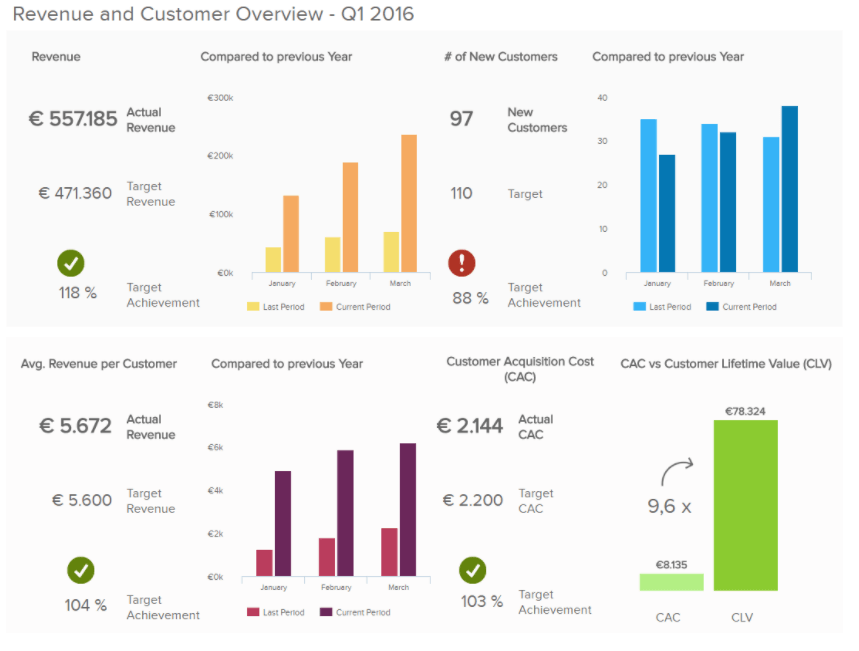
The four KPIs in this report template are prominently displayed:
- Number of New Customers
- Average Revenue per customer
- Customer Acquisition Cost
These metrics are set in context with historical trends, targets for the period, or other metrics like Customer Lifetime Value, causing this focused graph to tell a story.
9) Make your report very clear
In business writing and management reporting, clarity is the primary objective. This has several implications for your report design:
- Follow established dashboard design principles – give plenty of white space, ensure your colors stand out from each other, and select colors carefully.
- Don’t forget the small things – display a date range next to the data, and ensure it’s clear whether a given KPI is good, bad, or neutral. A good way to do this is by comparing expected values to real ones, like the expected revenue for a quarter to the actual revenue of this very quarter.
- Use common metrics that everyone who will read the report can understand and has experience with using.
For more tips & tricks on data-efficient reporting, you can read one of our previous blog posts on how to create data reports people love to read.
10) Be mindful not to mislead
As you learned in our two previous points, making your reports visually appealing and following design best practices is a fundamental aspect of achieving a successful management reporting process. Another important aspect to consider in this regard is to be mindful of how the information is presented to avoid being misleading. As a manager generating a report, it is very likely that you will have a diverse audience which can include people that are not familiar with the data presented in them. For this reason, following some best practices to avoid misleading reports can help you keep your work objective and easy to understand.
- Labels : When integrating several charts and graphs into your reports, labels play a fundamental role in how the data is perceived. For this reason, your labels should be short, clear, and concise. Avoid writing labels that guide the viewer to a specific conclusion or too complicated ones that can make the chart hard to understand.
- Axis: Manipulating an axis is a common form of misleading statistics used by the media and politicians to manipulate the public. A common bad practice in this regard is to start the X axis in a higher number than 0 to exaggerate a comparison between two data points. To avoid this, use your axis correctly, following charting guidelines.
- Cherry picking: This means picking only the data that will make you look good. As a manager, you obviously want to show how great the business is doing. However, showing only good results is a practice that can mislead the audience into believing something that is not the complete truth. Including bad results is a good way to learn and find improvement opportunities.
Your Chance: Want to test a management reporting software for free? We offer a 14-day free trial. Benefit from great management reports!
11) Go digital!
An important best practice for management reporting is to ditch paper-based reports and go digital. Online KPI reporting software is a great asset for your business, as they offer real-time updating capabilities, saves money, and reduces waste.
These digital reports can be made to be interactive, allowing you to get more granular or zoom out as you wish. Moreover, they are collaborative tools that let your team onboard the analytics train and work conjointly on the same report. Another example we will provide you with is the following marketing KPI report:
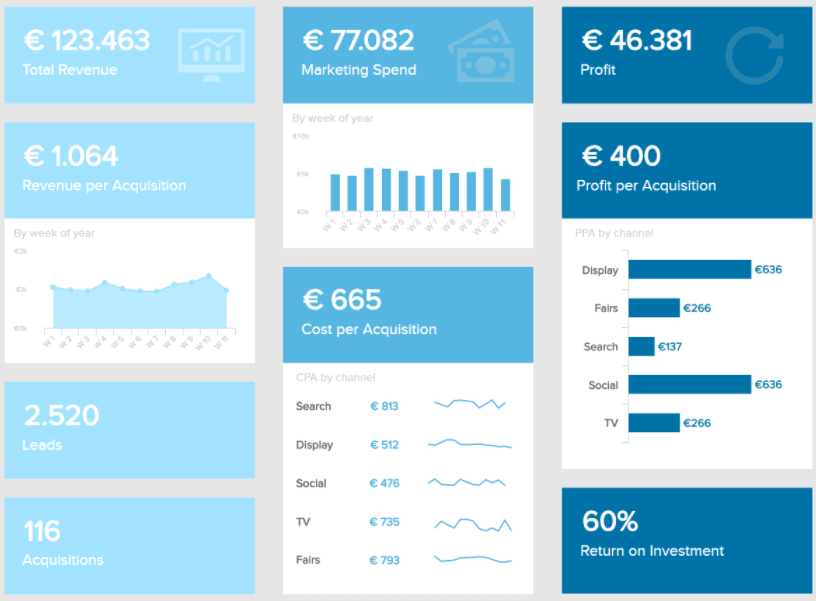
This is the perfect type of report a management team needs to ensure actionable, data-driven decisions: a high-level overview of the marketing performance is given. Indeed, focusing on the click-through rate, the website traffic evolution, or page views wouldn’t make sense. On the other hand, the big picture of how the marketing department works as a whole will be more appreciated: total revenue generated standing next to the total spend, the profit that came out of it, the return on investment, etc.
12) Strike a balance with your visualizations
We’ve established that making your report clear is vital to success. Another way of making sure that your management report format is digestible is to make your various visualizations balanced on the page. Our SaaS executive dashboard is an excellent example of a visually balanced format:

The primary focus of this particular example is to provide a customer-centric view of the costs, revenue, and performance stability of your SaaS-based activities from a senior standpoint.
As you can see, our SaaS executive dashboard serves up 4 performance indicators (Customer Acquisition Costs, CLV, ARPU, and MRR) to offer a concise snapshot for senior decision-makers, with each visualization selected based on their ability to offer at-a-glance information without clashing or creating confusion.
When choosing types of graphs and charts, it’s important to consider basic design principles while also considering whether each chart, graph, or display works cohesively to provide essential information without causing conflict or consuming too much time.
By considering the previous tips, testing your visualization choices, and considering your core goals throughout, you’ll create a managerial report that gets real results.
13) Make your report scannable & drillable
It’s clear that going digital with your management reporting system is essential in our tech-driven age. And as we touched on earlier, two of the significant advantages of these systems are interactive functionality and customizable features.
By being able to customize your reports with ease while taking advantage of interactive features, you can build on your data visualization selection and design practices to ensure your management report template is both scannable & drillable.
Take this dynamic project reporting example, for instance:
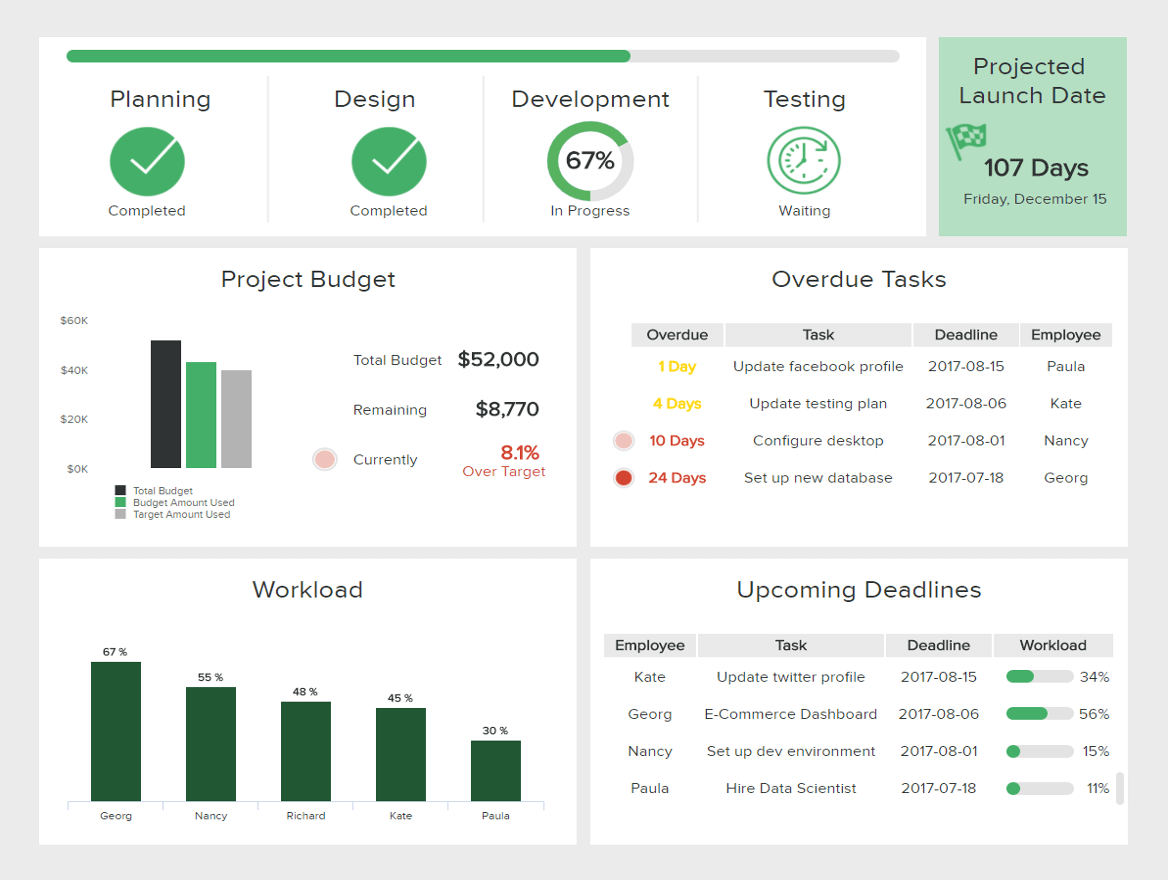
By making customizations and using interactive functions to drill down deeper into particular pockets of information, this IT report sample is effective for quick access to real-time project performance information as well as comprehensive trend-based data.
Working from the top left to the top right and down the project dashboard in a logical format, you can see the dashboard is entirely scannable and customized for cherry-picking important metrics. Here, it’s possible to get a clear gauge of project progress, looming deadlines, budgets, and workloads by simply scanning the page.
Plus, by taking advantage of interactive features and drill-down boxes, it’s possible to dig deeper into your data as required. By embracing customizable and interactive dashboard features, you can build your creations flexibly, working in real-time or with monthly management report tools. If you want to track your progress in a different format, you can take a look at our KPI scorecard article and organize your milestones differently.
14) Deliver real-time data that aligns with your objectives
Regarding major types of management reports, it’s important to understand when to lean on real-time insights. Knowing when to use this kind of dynamic data is the most prominent feature of your dashboard.
We’ve covered the importance of storytelling and selecting a balanced mix of KPIs (for past, predictive, and real-time insights). But what is important to consider with any management report sample is making sure your real-time insights fully align with your objectives.
The next of our examples comes in the form of our energy dashboard - a prime representation of well-placed real-time insights:
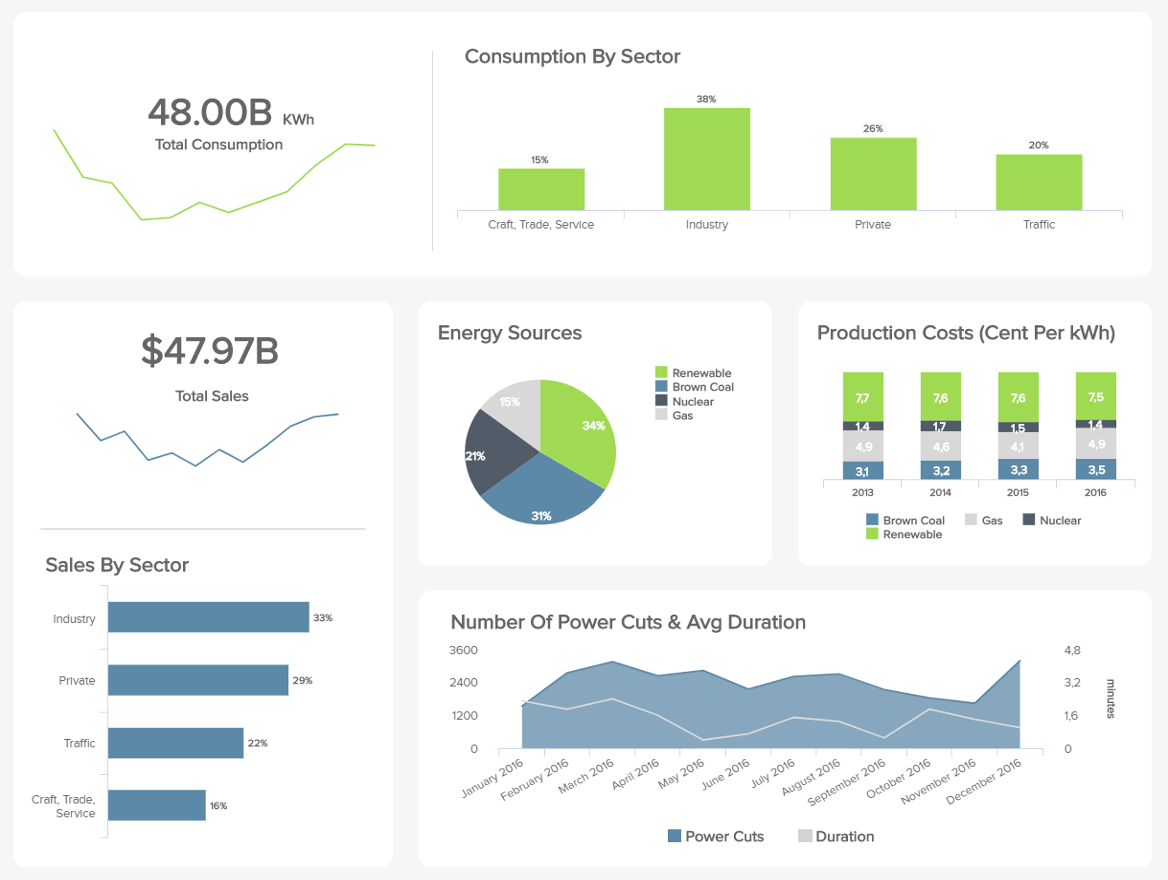
Energy management is challenging as it requires quick responses to potential issues or inefficiencies to prevent major losses or problem escalations by utilizing modern energy analytics solutions. As demonstrated in this most insightful example, while you can see a mix of data types, the real-time metrics reflect the core aims of monitoring energy consumption and improving powercut management.
When creating your report, here’s what you should do to ensure your real-time data aligns with your primary goals:
- Revisit your key objectives and KPI selections, studying them in greater detail to see whether your real-time metrics “tell a story or paint a picture” that your audience will benefit from.
- Run your report for a week, personally testing it to check if your real-time insights allow you to achieve your goals and make quick, informed decisions.
- Ask other key stakeholders within the organization to test your report and offer their feedback. Based on their (and your) discoveries, make tweaks, changes, or customizations accordingly.
15) Try Predictive Analytics & AI Technologies
Following the line of real-time data, our next best practice is related to advanced management reporting systems. To extract the maximum potential out of your reports, you need to be sure you invest in a tool that will make your process easier, more automated, and more time-efficient. To assist you with this purpose, there are several business analytics tools in the market that can offer you these types of solutions. Let’s look at what you can achieve with these technologies.
Predictive analytics: Unlike not many other solutions out there, datapine provides a predictive analytics tool that takes historical data in order to predict future outcomes in your business performance. Getting these kinds of predictions is valuable as it will let you prepare in advance for the future and spot any potential issues before they happen.
Artificial intelligence (AI): As we’ve mentioned a few times throughout this post, management reports should turn your life easier. For this reason, embracing the powers of AI can take your managerial data to the next level. datapine’s intelligent alerts use neural networks to learn from trends and patterns in your data so they can later notify you if something unusual happens. All you need to do is set predefined targets or goals, and the alerts will set off as soon as a goal is met or something is not going as planned.
16) Keep your dashboards actionable and improve constantly
Expanding on the previous point: whether a financial management report, a monthly management report sample, or any other type of senior dashboard, continual improvements will ensure your offerings remain relevant and actionable.
The digital world is constantly evolving, and as such, business goals, aims, strategies, and initiatives are always changing to adapt to the landscape around them. To ensure your reports work for you on a sustainable basis, you should periodically test each report to check for any irrelevant KPIs while looking for any reporting inefficiencies. This can be done simply by utilizing visual analytics tools that use the power of visualization to ensure your reporting stays on course and improves your business's bottom line.
At this point, you’ll have already laid out the framework for your reports, and by committing ample time to make updates as well as improvements, you’ll remain one step ahead of the competition at all times. Get testing!
17) Develop your reports collaboratively
Managerial reporting systems are designed to offer insight, clarity, and direction.
To squeeze every last drop of value from your managerial reports, you must commit to developing your reports according to the landscape around you—and the best way to do so is as a team.
By taking a collaborative approach to your company's reporting initiatives, you will increase your chances of making tweaks or enhancements that offer a real benefit to your business.
Suppose you're in charge of financial management reporting, for instance. In that case, you should create a tight-knit workgroup of relevant specialists within your organization to gather on a regular basis and assess the relevance of your KPIs or metrics.
With this mix of professional perspectives, you will gain the power to spot any existing report management system weaknesses (outdated visualizations, inefficient reporting layouts, unnecessary data, etc.) to ensure that your accounting management reports not only capture every valuable fiscal insight but work in a way that gives every user the tools to perform to the best of their abilities.
As modern management reporting templates offer flexible 24/7 access across a multitude of devices, it’s possible to develop or evolve your visualizations and insights collaboratively on a remote basis, if required.
18) Create a sense of cohesion & consistency
Concerning financial management reporting best practices, our dynamic financial dashboard is as good as it gets. With a balanced mix of scannable visualizations and KPIs designed to drill down into the four primary areas of CFO management, this particular tool demonstrates the unrivaled value of internal executive reports.
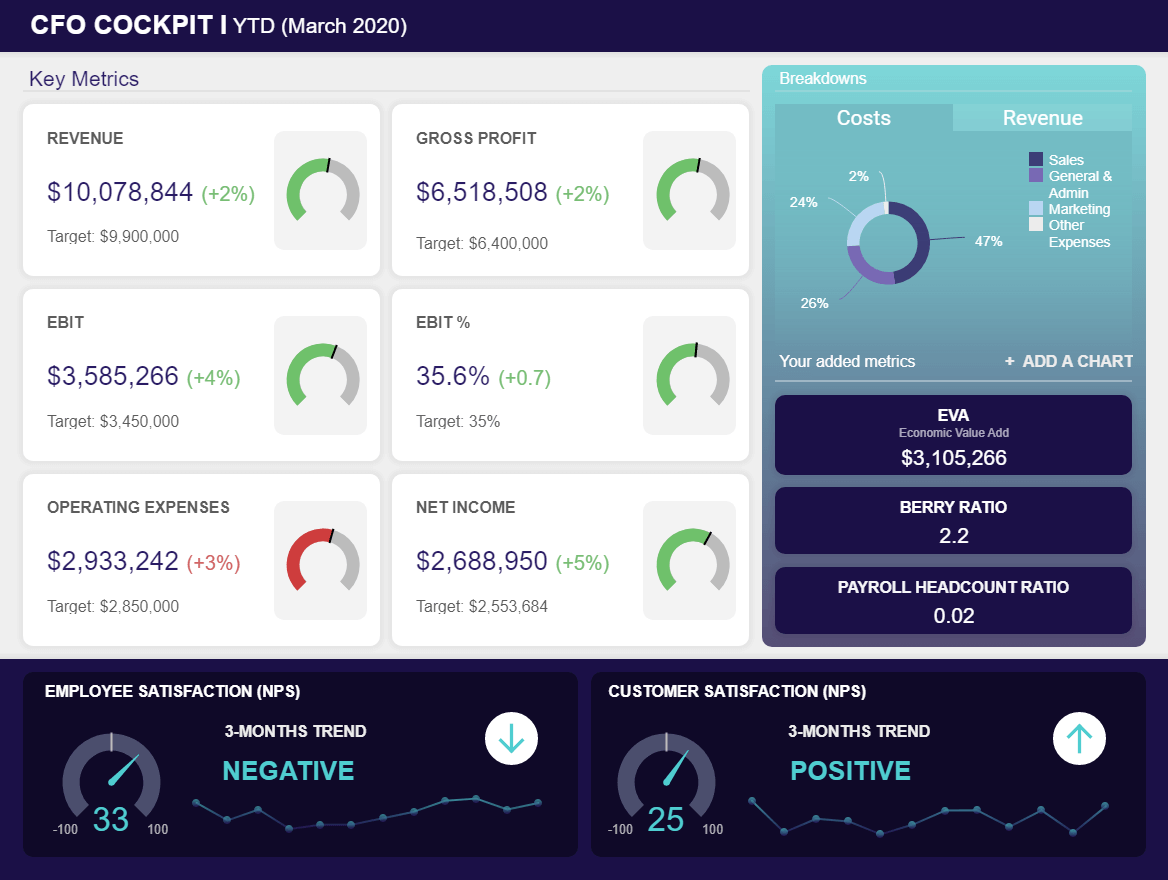
Here, everything is geared towards striking a balance between economic value, improved financial performance, and ongoing employee satisfaction, presented in a logical and digestible format for swift decision-making even under pressure.
One of the main reasons this CFO manager report template works so well is it is functional as well as visual cohesion and consistency. Every key element is neatly segmented on screen, with charts that offer a wealth of relevant information at a glance.
As you can see, everything flows, each element fits into the right place, the colors and tones are cohesive, and it’s clear where you need to look when you need very specific nuggets of information at the moment.
Using this template as a working example, which you can adjust also as a CEO dashboard , you can create various types of reports in management with visual and practical consistency and cohesion at the forefront of your mind. If something appears out of place or creates friction, return to the drawing board and start again until everything is harmonious and offers genuine value.
19) Compartmentalize your data effectively
Our striking IT dashboard is a dynamic informational toolkit for anyone leading a company’s technical innovation and progress.
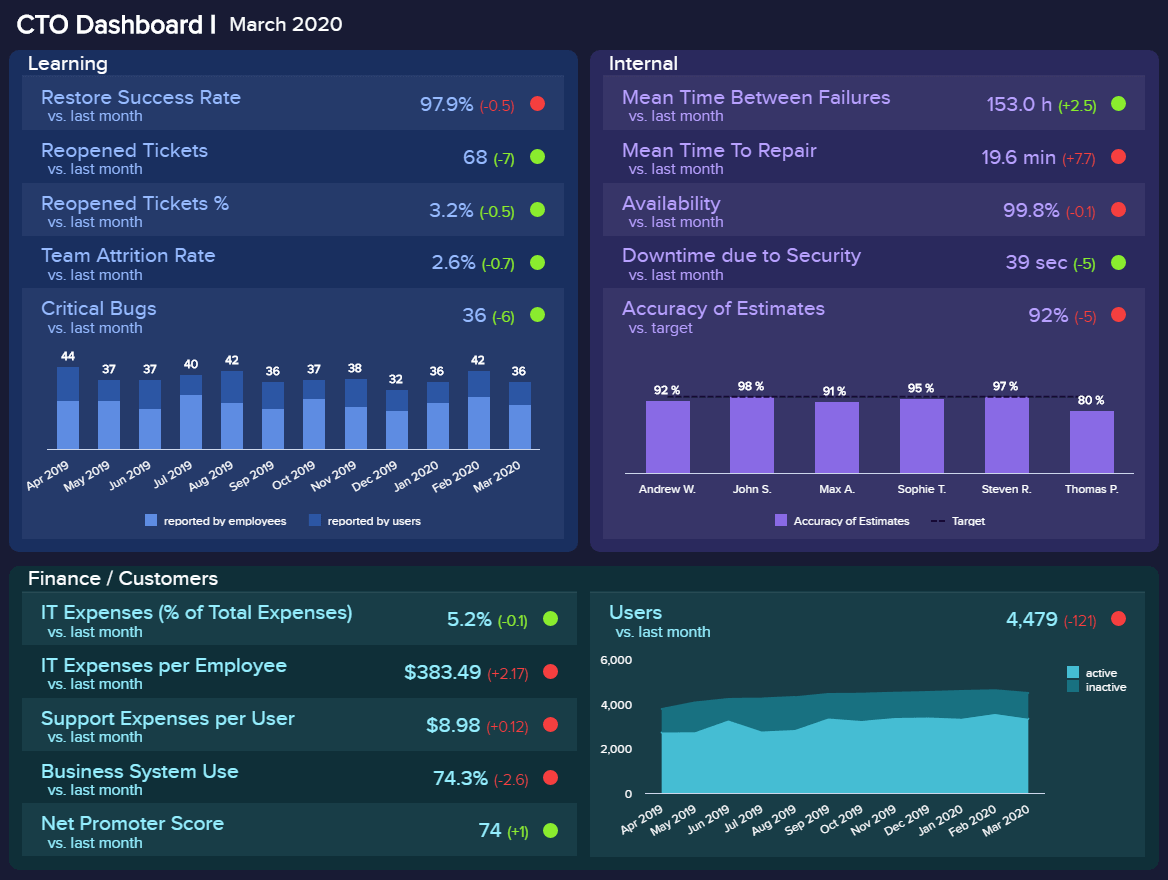
Whether you’re a small, medium, or large business (and regardless of your sector), our CTO-centric management reports template focuses on minimizing technical issues, streamlining tech-based processes, improving team attrition rates, managing new developments, and more.
In addition to its streamlined functionality and sheer reporting power, one of the key reasons this managerial report example is so powerful is its effective compartmentalization. Expanding on our last trip, by focusing on cohesion before considering how you will compartmentalize your insights, you will consistently get the most from your reporting efforts.
We touched on this before, but it’s a vital component of reporting, so it’s worth covering in further detail: once you’ve committed to your data and visual KPIs, examine how each key element fits into your report and place it into the ‘right compartment’ on-page.
Looking at the CTO dashboard, each core branch of information is split into a box under a clear-cut subheading. Within each of these compartmentalizations, there are clearly labeled data, insights, and visualizations.
By drilling down further into how you compartmentalize your reports, you will give yourself the ability to analyze one area of information or grab an entire snapshot at a simple glance. As a result, you will improve your business performance and streamline your decision-making process.
20) Create a scannable timeline
Employee management reporting helps managers make vital improvements to specific functions of the business with clear-cut direction and complete confidence.
Our HR dashboard — a must for any modern HR department — exists to assist personnel-based managers in keeping their employees happy, engaged, and motivated. Employees who feel valued and engaged in the business are generally more productive and more creative, so looking after your talent the right way should be one of your company’s top priorities — no exceptions.
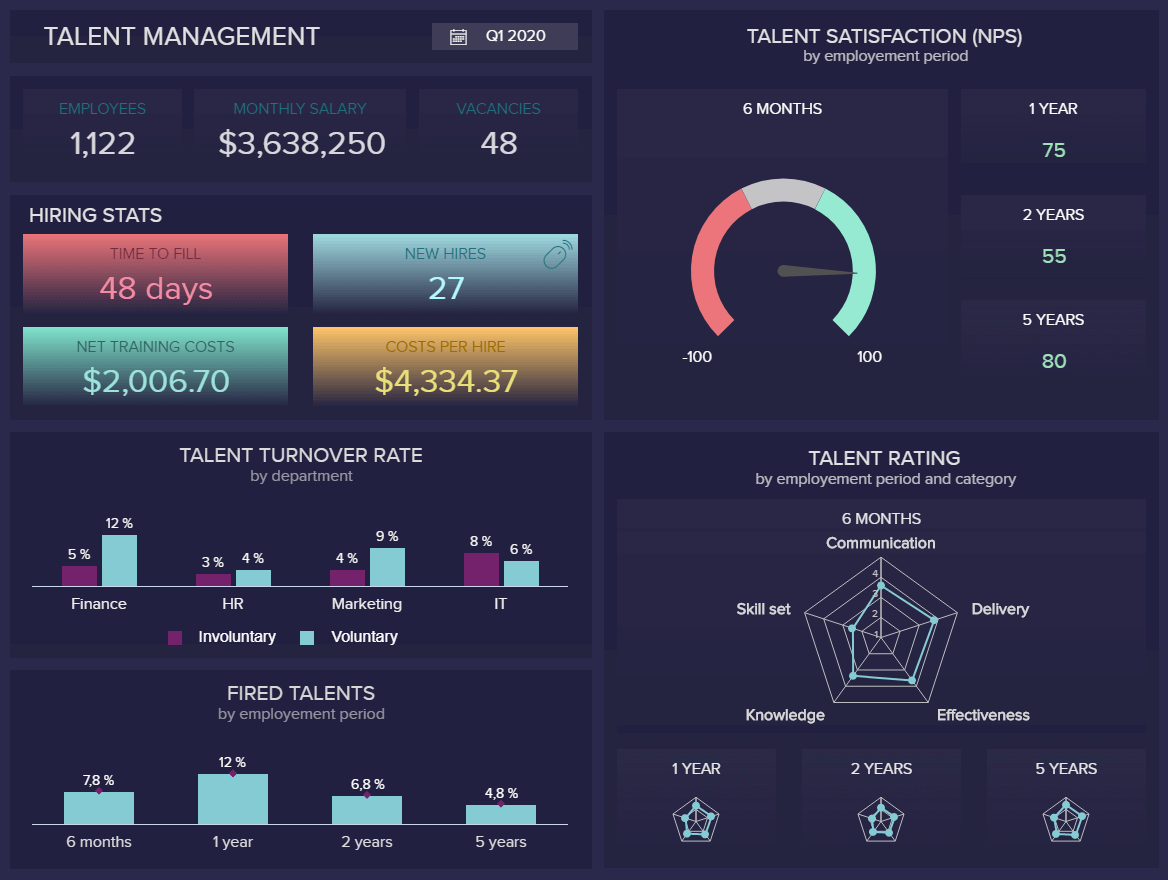
When it comes to HR, managers need to take care of many tasks, which include picking the best payroll system, conducting performance reviews to ensure productivity, hiring the right talents, and more. Putting the talent area into perspective, our HR management reporting template serves up a perfect storm of data-driven insights that covers staff turnover, dismissal, rising talent, and overall satisfaction levels. For example, the talent satisfaction KPI for HR managers gives you a clear overview of whether your business gives enough incentives to satisfy your current workforce.
But not only here, but you will also gain a deep working insight into where you might be going wrong while capitalizing on your strengths and, ultimately, offering the right reward, recognition, training, and support where needed.
What makes this workforce management reporting example so successful is the fact that it provides a solid timeline of information. By working down or across, you can access an excellent balance of historical, real-time, and predictive knowledge with ease.
As such, this report paints a data-centric timeline that will empower any HR manager to examine trends, understand fluctuations in employee engagement rates, and create viable strategies that increase retention while boosting productivity.
The takeaway here? When considering the contents of a good managerial report, it’s always important to look at how your visualizations and design layout create a timeline that allows you to formulate initiatives that will benefit the business both in the moment and in the future.
21) Embed your reports
As we are about to reach the end of this insightful list of tips and best practices, we couldn’t leave out one of the technologies that have revolutionized the reporting landscape: embedding analytics. Essentially, embedding a report means integrating all the functionalities of a business intelligence reporting software , such as dashboards, charts, and more, into your company’s existing system.
Having access to this type of technology is not only way cheaper as your company doesn’t need to invest in creating a system of its own, but it can also provide a great competitive advantage. Embedded dashboards and reports are fully customized to the colors, logo, and font of the organization, allowing employees and managers to enjoy all the functionalities of a reporting system in a familiar environment which can boost productivity and performance.
22) Don’t neglect security and privacy
So far, we’ve covered tips related to the planning, design, and usability of your reports. Now, we will talk about a topic that is often overlooked but is becoming increasingly important, privacy and security. According to research , in 2021, 70% of small businesses reported a cyberattack of some kind. The financial impact of these attacks can significantly damage an organization. It is believed the average cost of an email comprise attack is $130.000. At the same time, ransomware attacks are projected to reach $11.5 million in damages this year.
That said, privacy and security issues affect businesses on a financial level but also on a reputational and legal one. Not protecting sensitive customer and employee data, such as addresses, bank records, phone numbers, and others, can expose them to serious damage that can lead to legal repercussions.
To prevent critical business information from falling into the wrong hands, you should implement strict access controls, data encryption, and data anonymization processes, among other things. Plus, you should train your employees about potential threats and prevent risky behaviors, such as accessing reports on a public network. Tools such as datapine provide a secure environment for your management reporting process. This includes secure sharing options such as password-protected URLs or strict viewing rights to make sure only authorized people have access to the reports.
23) Explore self-service analytics tools
The times when financial or management reports were only meant for analysts or scientists are long gone. In today’s data-driven era, if a business wants to succeed and get an advantage over competitors fully, they need to make sure that everyone in its organization can benefit from data analysis. For this purpose, implementing a self-service business intelligence tool can be the answer.
In simple words, self-service BI refers to the process or tools companies use to analyze and visualize their data without needing any prior technical skills. Management reporting systems such as datapine include a user-friendly interface as well as an intuitive dashboard designer that will allow you and anyone in your business to visualize insights from several sources and create powerful reports with just a few clicks. Businesses that benefit from these types of solutions can extract valuable information into their performance and constantly spot improvement opportunities.
24) Assess data literacy
As mentioned a couple of times already, in order for your management reporting process to be efficient, it is necessary to involve the entire organization. While self-service tools such as the ones we mentioned in the previous point are extremely valuable to achieve this task, there is still a level of knowledge or analytical awareness that needs to be had across all employees for the process to be successful. To do so, assessing the level of data literacy is a great place to start.
Data literacy refers to the ability to understand and communicate using data. To evaluate the level of literacy of your employees, you can carry out surveys to categorize them depending on their level of knowledge. With the results, you can set up training instances to get everyone in the same place with the tools and concepts that will need to be used across the organization’s analytical journey. In time, everyone will be able to generate stunning management reports and use them to collaborate with each other. This leads us to our next and final best practice.
25) Encourage a data-driven culture
Following on from the prior point, by implementing self-service solutions, you will gain an invaluable benefit: a data-driven culture for your business. Your company culture is the blueprint for how your business runs, as well as how everyone within your business interacts or operates internally. Naturally, your internal culture will have a notable impact on the way your clients, customers, and affiliates view your business.
Seventy-eight percent of top business leaders believe that company culture is among the top five things that add value to their company. That said, if you want to maximize the power and wider organizational values of your data-driven reporting efforts, you should make it a key component of your company culture.
If you place the value of data and using it to its maximum capabilities at the heart of your company culture, you will empower everyone to embrace and make use of the reporting tools that will improve their performance while making their roles easier (which, in turn, will boost employee satisfaction levels).
To do so, you should hold regular meetings to explain how data reporting can benefit every department within your organization while holding educational workshops where everyone within the business can learn how to use the tools.
Let’s now go over the history of these reports, where they come from, and how they have been developed.
History And Trends Of Management Reporting
In the past, legacy systems were used to prepare reports for management – and still are, in many cases. These systems are much more useful than financial reports but still have their drawbacks. Legacy systems are often quite technical in their operation and interface, which makes them challenging for most non-IT personnel to use effectively. This creates a situation of “lag time” between a member of management wanting a report and actually receiving it.
In modern times, with the breadth and depth of data available growing at an astonishing rate, these challenges have only escalated. As Peter Wollmert, an EY global leader, stated in a quote from a Financial Director article: “Many [CFOs] are encumbered by legacy systems that do not allow reporting teams to extract forward-looking insight from large, fast-changing data sets.”
To put the rise of management reporting into perspective, let’s analyze the results of Deloitte’s survey about the changes in this managerial practice. As we mentioned before, top managers are no longer satisfied with static financial reports that don’t provide the level of insights the business needs to grow. Although getting a clear picture of a company’s finances is fundamental, modern management reports provide the context and reasons behind the business's financial results, which makes it possible to go deeper into the roots for better decision-making.
Although managers have the willingness to adopt these reporting practices, the survey shows that only 24% of the reporting time is actually spent doing analysis and building strategies. The reason is businesses today are still spending an insane amount of time building their reports. Paired with this, 50% of respondents said they were unsatisfied with the speed of delivery and the quality of the reports they received.
What businesses need today are management systems that will provide them with the perfect mix of internal and external real-time data to put their business performance into context and drive those much-wanted business insights.
Tools such as datapine provide businesses with an all-in-one management reporting system in which they can connect all their data sources to create real-time automated reports in the form of professional business dashboards . By adopting this type of technology, managers and their teams can save countless hours on manually gathering the data and creating the reports, and spend all the necessary time monitoring and analyzing their performance in the most interactive and efficient way.
Why Is It Important To Write A Management Report?
For any function and in any industry, reports are more than useful, they are crucial to the well-functioning of the company.
Reporting is all the more important in management as it has higher stakes and holds bigger, cross-disciplinary decisions. In general, reports are important to management for various reasons: they measure strategic metrics to assess and monitor the performance, they set benchmarks about said performance, enable the business to learn from its activity by leaving a track record, and finally, enhance communication. Here’s a short list of benefits:
- Measuring strategic metrics to assess and monitor the performance: by now, we’ve understood that if businesses wanted to grow, they would need to implement a way to measure their performance against their competitors – but also against their own
- Helping you understand your position: a management-style report provides you with the right metrics to get a snapshot of your business's health and evolution. You can compare it to your competitors to focus on or realign your strategy.
- Setting clear-cut performance benchmarks: thanks to that track record, you have a regular benchmark about how you perform both operationally and financially.
- Learning and reproducing – or not: benchmarks are a guide to tell you what works and what doesn’t. From it, you can learn the best and worst practices to develop or avoid.
- Enhancing communication: among partners, investors, customers, and colleagues. Management-type reports develop the visibility of the different activities across departments and improve communication within the company.
- Improving collaboration: as a direct result of improved internal communication, senior-level reports enhance interdepartmental collaboration. With people working cohesively towards a common goal, departments can use management reporting discoveries to collaborate on specific projects or initiatives, catalyzing success in a number of key areas.
- Boosting engagement & motivation: a well-crafted manager-level report makes critical company data accessible to all, which improves individual performance. When people perform at an optimum level and are recognized for their work, they will become more engaged, inspired, and motivated. This, in turn, will increase productivity across the organization.
- Fostering continual business growth: solid reporting in management indeed improves productivity and decision-making, which fosters consistency as well as continual business growth. If you’re growing consistently over time, you will ensure long-term success - the most powerful benefit of reporting in management.
Essential Types Of Management Reports
As we’ve mentioned throughout this post, there is an immense amount of growth possibilities when implementing a modern management reporting system in your business. To finalize interiorizing you into the benefits of these powerful tools, we will mention 9 essential types of reports for management you can adopt for different analytical purposes.
- External reports: We’ve already introduced you to this type of report at the beginning of the post. As its name suggests, these reports are aimed at external stakeholders, which can be investors, creditors, suppliers, and bankers, among others. These reports can also be used to provide context into something that might be affecting business performance, for example, industry trends.
- Internal reports: The next in our list are internal ones. This refers to any managerial task that must be reported on, and it is not expected to follow legal format standards. Internal reports can be used for top-level, middle-level, or lower-level management, and their frequency will vary depending on their main goal.
- Progress or status reports: Tracks the progress of a project or a goal in detail. By using this type of management report, you can track all activities related to the completion of the project, see how far you are from the final goal, and if tasks are running at the expected schedule.
- Operational reports: This type aims to track all aspects related to the operation or performance of different metrics. They are usually created on a daily, weekly, or even monthly basis and are used to optimize business processes, lower costs, spot trends, and improve the overall day-to-day running of the company.
- Analytical reports: This type of business report uses quantitative and qualitative data to analyze, evaluate, and filter the performance of a company's strategies. They can deliver predictions and trends for better decision-making and business innovation.
- Industry reports: As its name suggests, this type gives managers an overview of the industry's status. These reports are helpful because they enable decision-makers to understand their position in the industry and their competitors. The insights provided in this report can help businesses extract benchmarks to measure their performance.
- Product reports : C-level executives need to oversee every single aspect of the business, and one of them is product development. These reports provide a complete overview of product development, such as feature adoption, top-selling products, and willingness to pay, among other things. Through them, decision-makers can find improvement opportunities and boost their products and services through the power of analytics.
- Project reports: In a business context, there is always a range of projects being carried out. These reports provide an overview of the development of a project with insights into completed and upcoming tasks, budget usage, competition percentage, and launch dates, among other things. Through them, teams can stay connected to ensure every task is carried out efficiently and in the expected time.
- Compliance reports: As mentioned previously, companies have been generating financial reports for decades. These reports enable them to stay compliant with law and tax regulations and provide an accurate picture of financial health to investors and other external stakeholders.
What Should A Successful Management Reporting System Include?
In our 25 tips to generate efficient management reports, we presented you with a few features any software worth its salt should include, such as real-time data, embedding capabilities, predictive analytics technologies, and more. A management reporting system that wants to be successful in today’s fast-paced world needs to support itself with a set of functionalities and technologies that will make it more efficient in various aspects. Paired with the features we already presented before, a couple of others that are fundamental include:
- The ability to connect multiple data sources
If you’ve ever dealt with generating a report, then you must be aware of the fact that manual work is the enemy of productivity. For this reason, your management reporting system should provide you with the possibility to automatically connect multiple external and internal data sources with just a few clicks. Management reporting tools, such as datapine, offer professional data connectors that allow users to merge all their sources into one location. The best part is that the information in them is updated automatically, eliminating any kind of manual work from the process.
- Be user-friendly and intuitive
Another important functionality is user-friendliness and accessibility. Analytics has become a mandatory practice for modern businesses, meaning generating reports and analyzing the information in them is a task that cannot be segregated to people with technical knowledge anymore. When investing in professional software, ensure it has a user-friendly interface that anyone in your organization can use. This way, you’ll make sure all employees are empowered to integrate data into their daily routines.
- Interactive filters to explore your reports
While report generation is an important part to consider, data exploration is equally as important. Traditional reports created on PowerPoint or Excel often limit users to only analyze the information that is visually available. Modern management reports should be interactive and provide a set of filters that allow users to navigate the data and extract deeper conclusions from it. For instance, datapine’s drill down filter allows you to explore lower levels of data just by clicking on a specific chart. For example, say you have a chart showing sales by product category. A drill down would allow you to click on a specific category and see the best-selling products in that category. This proves to be a great method to support discussions and make more improved strategic decisions.
- Automation of various tasks
Going back to the first point, automation is key when it comes to achieving an efficient management reporting process. We already talked about merging your sources of information as a key automation feature. However, this is only the tip of the iceberg. Any reporting system worth its salt should also provide other automation features, such as report automation and sharing. This means telling the tool that you want to generate a report with specific data in it, and you want it sent to a specific recipient on a specific date and time, and the system should do it on its own. Relying on automation for various tasks that would otherwise take a lot of time and resources is a great way to focus your efforts on growing the business and carrying out successful strategies.
How To Prepare A Management Report – Summary
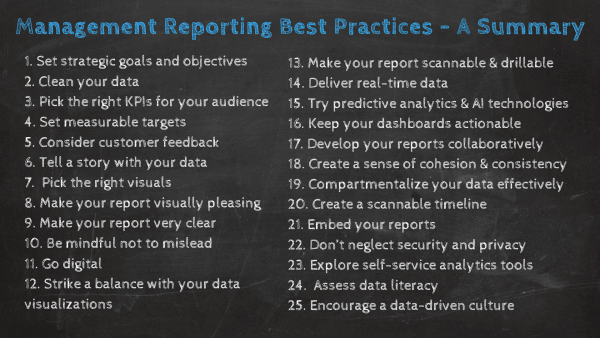
To sum up, the main steps we have explored throughout this guide and cement our understanding of the question “What is management reporting,” here is a list of the 25 best practices you should use to prepare a solid report or overview. By taking the time to get acquainted with these approaches, you will boost your business intelligence (BI) initiatives sooner than you think.
Without further ado, let’s summarize:
- Set the strategic goals and objectives : Start by defining what you want to achieve, why you need to write that report, and who you are writing it for.
- Clean your data : Make sure it is clean from any formatting errors or duplications to avoid damaging your analysis later.
- Choose the right KPIs for your audience: Different positions have different needs – keep in mind who will read what you write to know what you need to focus on.
- Set measurable targets: Set performance benchmarks or targets to evaluate the success of your strategies toward achieving general company goals.
- Take customer feedback into consideration: Customers are the backbone of any business, and you need to understand what your business is doing wrong as well as right.
- Polish your storytelling skills : You have hard data in your hands that need to be understood by everyone: clarifying it with a nice story backed with a comprehensive dashboard will convey your insights even more easily.
- Pick the right visuals: Understand the goal of your reports to help you pick the right graph or chart to visualize your data.
- Make your report visually pleasing through focus : With the help of BI software, you can build compelling dashboards in no time that will be your best ally when communicating your findings.
- Clarity is the watchword : Follow some presentation and design principles to stay on the safe side while elaborating your report.
- Don't mislead : make sure you follow design best practices and avoid unethical manipulations of the data to avoid misleading your audience.
- Go digital : Paper-based reports are of the past. Put your hands on an online dashboard tool that will let you consolidate your data in one central place and quickly and smoothly build interactive reports with always up-to-date information.
- Striking the balance : To ensure you get the most from your centralized digital dashboards, you need to make sure that the visualizations work well on-page and help those within your organization obtain at-glance information with ease, devoid of confusion.
- Scannability + drillability = success: By taking full advantage of the interactive functionality of digital reporting dashboards, you can improve the scannability of your dashboard reports while using filters and drill-down boxes to dig deeper into important pockets of information with ease.
- Real-time data relevance: Real-time insights are invaluable to any organization—but only if they align with your core reporting goals. Test your reports before rolling them out across the organization, checking your real-time metrics for clarity and relevance.
- Keep on improving: The digital world is constantly evolving. Sector, niche, or industry aside, you must regularly test your reports, making changes or customizations to iron out any data that has become redundant or inefficient. Never stop testing; never stop improving.
- Use predictive analytics & AI: Benefit from advanced analytical technologies to spot trends and patterns in your data and get a pick into your future performance.
- Develop your reports collaboratively: When improving and enhancing your reports and dashboards, you should work as a tight-knit team, taking everyone’s ideas and perspectives on board. Doing so will ensure your reports are valuable and built for success at all times.
- Create a sense of cohesion & consistency: From both a visual and functional perspective, focusing on creating a sense of consistency and harmony with your KPIs and visualizations will improve your reporting success across the board.
- Compartmentalize your data effectively: In addition to making sure you create cohesion within your on-page reporting layout, you should also compartmentalize every key branch of information, creating separate boxes and subheadings for quick access to effective information.
- Create a scannable timeline: When creating your dashboard reports, developing an informational timeline over a specific period will make it easier for you to put together strategies and initiatives in a wealth of key areas.
- Use embedding analytics : Use this technology to make your reports more professional and accessible to all stakeholders.
- Don’t neglect privacy and security: Implement security measures to ensure your financial, customer, and employee data doesn’t fall into the wrong hands.
- Use self-service analytics: Involve all your employees in your reporting process with the help of intuitive self-service BI tools.
- Assess data literacy: Evaluate your employee's analytical knowledge and provide training instances where needed.
- Encourage a data-driven culture: Your company culture is, in many ways, the beating heart of your entire business. By taking measures to place respect and value for data-driven reporting at the heart of your business, you will empower everyone to embrace the concept, boosting the value of your dashboard-centric efforts.
With all of these reporting best practices, you can now perform online reporting that will help your company’s leaders to make effective, data-driven decisions.
Key Takeaways Management Reporting
On our journey, we’ve outlined the management reporting definition, looked at management reports examples, explored best practices, and drilled down into the business-boosting benefits of dynamic digital dashboards.
It’s clear that by embracing the wealth of digital data available to your business and harnessing it effectively, you stand to make the kind of management decisions that will drive your organization forward with force, accelerating your success in the process.
In a nutshell, you should follow the management reporting examples by hand-picking a few relevant KPIs to display and tell a clear story with your data. It’s also essential to work collaboratively, creating a healthy ecosystem of data-driven innovation that will empower everyone in the business to benefit from the unrivaled power of managerial-style reporting. Knowledge is indeed power, and if your business runs on it, you will reap great rewards, both now and in the long run.
Combine this concept with the help of our BI dashboard software which will empower you to work on the evolution of your data in real-time while enabling you to create efficient dashboards, and you will drive your business well above the competition.
Take charge of professional destiny today by trying datapine with a 14-day trial , completely free, and start creating your own reports just with a few clicks!
Have a question? Call us 877-735-7693
- Client Login

- Controller Services
- CFO Support Services
- Management Accounting Services
- Advanced Bookkeeping Services
- Service Businesses
- Architecture Firms
- Engineering Firms
- Marketing Agencies
- GrowthForce Experience
- Team & Technology
- Client Testimonials
Management Reporting Capabilities for QuickBooks® by Industry
QuickBooks ® has become one of the leading bookkeeping and accounting solutions for small business owners to medium size business C-level executive users.
Many businesses use QuickBooks ® to monitor their business’s financial standing because you get fantastic financial reporting for the price. However, the management reporting standards and capabilities aren’t the same across all industries.

In this blog, we are going to focus on QuickBooks ® management reporting capabilities by these four industries: Manufacturing, Retail, Nonprofit and Service.
What Are Management Reports?
CEOs must accomplish many things on a daily basis from managing projects, people, inventory, etc., and to truly have a handle on their business, management reporting is required.
Unlike financial reporting, management reports show you what is driving sales, who your most profitable customers are and how you can increase staff productivity.
Now, how does QuickBooks ® handle this type of reporting by industry? We are going to break it down for you and assign grades.
QuickBooks ® Management Reporting for Manufacturing Businesses – Grade: C
When you manage things in manufacturing, you are managing things like the shop floor, machinery and raw materials that are coming in the door. QuickBooks ® management reporting is average for manufacturing companies and doesn’t go above and beyond.
Formulas, or assemblies, need to be created in QuickBooks ® in order to see the completion of the finished product or good.
For example, if you are making a bicycle you have items like a frame, brakes, wheels and handlebars which are all individual inventory parts in your warehouse. QuickBooks ® requires users to create an assembly to show how the parts come together to produce the final bicycle.
You can also add labor on top of the assembly. QuickBooks ® allows you to allocate the parts, time and labor that went into creating a final product which can be reflected in the final pricing.
However, the assembly feature does not have a lot of sophistication. For instance, if you are a manufacturer that produces lipstick that has glitter inside of it, it’s difficult to track how much glitter is in each lipstick or how much you have left.
That’s why we give QuickBooks ® a C for manufacturing businesses. They offer some businesses all the capabilities they could need but it can’t handle the advanced tracking more robust manufacturing operations need. Integrating apps like Fishbowl Inventory can help your company grow with QuickBooks ® and get the reporting you need.
QuickBooks ® Management Reports for the Retail Industry – Grade: D+
In service businesses and nonprofits, you are managing people and projects. In manufacturing, you’re managing raw materials. With retail, you’re managing inventory turnover. You manage sales day by day and look at how things are selling during different periods of time.
Retail companies don’t operate in typical quarterly increments like most companies do. They usually look at sales in terms of a rolling 13-week period. That’s why it’s hard to track management reporting in QuickBooks ® when it comes to retail businesses.
QuickBooks ® only has the capability to report in one week, two weeks, half a month or whole month periods. This means retail companies have a hard time seeing what sales were like on a rainy day verse a sunny day or that a pool company is going to get really busy before the 4 th of July.
Even with an integrated Point of Sales (POS) system, QuickBooks ® can’t provide this detailed information. QuickBooks ® POS software is difficult to use and you’ll need an expert to get the kinds of management reporting your business needs.
That’s why we say it’s a D+. It’s not failing – it just not something we would recommend a retail company using to track their management reports.
QuickBooks ® Management Reporting for Nonprofits – Grade: B
Nonprofits often assume they need to buy the nonprofit edition of QuickBooks ® to get all the right features and functionality. However the only difference between the Premier Nonprofit edition and the regular Premier edition is the invoice form changes to a pledge form and labels are changed to make them nonprofit specific.
QuickBooks ® management reporting falls short on donor management and automation. Other systems that integrate with QuickBooks, like Fund Master, help with direct mail and proposal management but QuickBooks ® doesn’t allow for advanced CRM capabilities.
QuickBooks ® also only tracks commitments, not the actual donations you will receive. Someone could commit to pledge $5,000 each year for five years, but if money becomes tight, they don’t have to donate that amount. QuickBooks has a hard time accounting for that. We give QuickBooks for Nonprofits a B – It gets the job done and does well for many nonprofits, however organizations with more advanced needs may need to look at nonprofit-specific software.
We tell all of our nonprofit clients to purchase their QuickBooks software from TechSoup because they offer the software at a cheaper price than you can get anywhere else for 501(c)3 organizations.
QuickBooks ® Management Reporting for Service Businesses – Grade: A
We saved the best for last. QuickBooks ® management reporting is top notch when it comes to service businesses. Since payroll is roughly 80% of cost for service businesses, management reports are valuable to gain insight on your people and how they drive profitability.
QuickBooks is excellent at a key area of management reporting, especially for service businesses, job costing. Depending on your payroll provider, you can set QuickBooks ® up so that when you run payroll, it automatically pulls employee timesheets and allocates it to jobs so you can see true labor cost.
You can also code customers to a certain marketing campaign, and when you group all the customers that attended, you can see how much was earned for a specific campaign. If your business doesn’t use marketing campaigns, management reports can show you ROI on marketing money spent.
If you unleash the advanced features of QuickBooks ® , you have the ability to provide profitability any way your company is organized. That’s why we give QuickBooks ® management reporting capabilities an A.
It’s not an A+ because there are limitations to management reports with QuickBooks ® . It can’t do chart of accounts and can’t change the database which is burdensome, especially for larger companies. However, it is better than anything else in the market place for the price range.
Why QuickBooks Management Reporting is Best for Service Businesses and Nonprofits
QuickBooks management reporting capabilities depends on many factors like what industry you’re in, how complex your transactions are and what kinds of management reports you need . GrowthForce has chosen to specialize in service businesses and nonprofits because QuickBooks ® is great for these industries.
GrowthForce is an Inuit Premium Reseller with Advanced Certified QuickBooks ® Pro Advisors and believe service businesses and nonprofits can get top notch management reporting for their company through QuickBooks ® .
GrowthForce aims to take away the guesswork for CEOs and owners when it comes to managing their business. We provide monthly financial and management reports you can trust to run your business and maintain your books to help solve problems and issues when they arise.
If you are a service business or nonprofit, imagine having the peace of mind about your business’s financial health because you have your fingers on the pulse of the drivers of your business. Let us help you set up custom management reports so you can start making informed decisions over your gut instinct.
Recent Blog Posts
Nonprofit chart of accounts: samples and how to get started, the month-end-close checklist for your finance team, why sage intacct dynamic allocations is a gamechanger, subscribe here.
- Bookkeeping Services
- Accounting Services
How It Works
- Accounts Payable Processing
- Accounts Receivable Processing
- Account Reconciliation
- Payroll Processing
- Cash Flow Forecasting
- Management Reporting
- Sales Tax Processing
- Document Management
- Internal Controls
- Month-End Close
- Job Costing
- KPI Scorecards
- Partnerships
- CPA/CFO AFFILIATES
GrowthForce is not a CPA Firm.
GrowthForce accounting services provided through an alliance with SK CPA, PLLC.
© Copyright 2018 GrowthForce, LLC. All Rights Reserved.


Mastering QuickBooks For Bookkeeping Reports
QuickBooks remains a reliable companion for entrepreneurs and small business owners in the ever-changing landscape of business and finance. QuickBooks’ user-friendly interface and powerful features have made it a hallmark of efficient financial management.
As businesses deal with the complexities of their financial transactions, mastering QuickBooks becomes increasingly essential. We will focus on the top fifteen most valuable bookkeeping reports that can transform how businesses approach financial management.
These reports provide critical insights into a company’s financial health and serve as invaluable tools for making sound decisions. Let’s talk about the significance of QuickBooks and the importance of using bookkeeping reports for effective and strategic financial management.
Understanding QuickBooks Bookkeeping Reports
In financial management, QuickBooks bookkeeping reports are indispensable tools that empower businesses to understand their financial landscape comprehensively. These reports go beyond the basic recording of transactions. They offer a detailed and organized presentation of financial data.
QuickBooks provides a robust suite of reporting options that cater to various aspects of financial management, from income and expenses to payroll and tax-related information.
How These QuickBooks Bookkeeping Reports Contribute to Financial Insights
The significance of QuickBooks bookkeeping reports lies in their ability to transform raw financial data into actionable insights. By generating reports that consolidate and categorize financial information, businesses can gain a clear overview of their financial standing.
Income, balance sheets, and cash flow statements are just a few reports that contribute to a holistic understanding of a company’s fiscal health. These reports not only aid in tracking revenue and expenses but also offer insights into trends, anomalies, and areas for potential improvement.
In addition, QuickBooks bookkeeping reports provide the analytical foundation required for informed and strategic financial management, whether analyzing profit margins, identifying cost centers, or assessing the impact of financial decisions.
What Is the Importance of Proper Bookkeeping?
Proper bookkeeping is the cornerstone of sound financial management for any business. At its core, the purpose of proper bookkeeping is to methodically record, organize, and track financial transactions. It provides a reliable and accurate snapshot of a company’s financial health.
This meticulous documentation goes beyond compliance with regulatory requirements; it plays a pivotal role in shaping the strategic direction of a business. The importance of proper bookkeeping extends across various facets of organizational success, and here’s why it stands as a non-negotiable aspect of effective business operations.
It provides a clear financial picture of a company
Proper bookkeeping ensures a transparent and detailed account of a company’s financial activities. It gives stakeholders, including business owners, investors, and regulators, a clear understanding of where the money comes from, how it is used, and the overall financial position of the business.
Accurate and up-to-date financial records
Accurate and up-to-date financial records empower decision-makers within a business to make informed and strategic choices. Whether it’s planning for expansion, assessing the feasibility of a new project, or identifying areas for cost-saving, well-maintained books serve as a reliable foundation for effective decision-making.
Tax laws and regulations
Tax laws and regulations can be complex and are subject to change. Proper bookkeeping ensures that a business maintains compliance with tax requirements, facilitating the timely and accurate filing of tax returns. This not only helps in avoiding penalties but also optimizes a business’s tax position.
Strategic resource allocation decisions
Understanding the inflow and outflow of funds allows businesses to allocate resources efficiently. Proper bookkeeping provides the necessary insights to make strategic resource allocation decisions, whether managing working capital, controlling expenses, or optimizing cash flow.
Enhances the credibility of a business
Businesses often engage with various stakeholders, including clients, suppliers, and financial institutions. Proper bookkeeping enhances a company’s credibility by showcasing a commitment to financial accountability. This, in turn, builds trust among stakeholders, fostering positive relationships that are vital for long-term success.
Well-maintained books
In the event of an internal or external audit, having well-maintained books simplifies the process. Auditors rely on accurate financial records to assess a company’s financial position and ensure compliance with accounting standards and regulations.
The Top 15 Most Valuable QuickBooks Bookkeeping Reports
QuickBooks offers a variety of reports that can help business owners gain insights into their financial health and make informed decisions. The importance of specific reports may vary depending on the nature and size of the business, but here are 15 valuable QuickBooks bookkeeping reports that many business owners find useful.
1. Profit and Loss Statement (Income Statement)
The Profit and Loss Statement, or Income Statement, is a fundamental financial report that provides business owners with a summary of the company’s revenues, costs, and expenses over a specific period, typically monthly, quarterly, or annually. The primary goal of this report is to show the net profit or loss incurred during the specified time frame. It is essential for assessing the business’s financial performance and overall profitability.
The Profit and Loss Statement allows business owners to evaluate the company’s financial performance and identify trends over time. It provides critical information for strategic decision-making, such as adjusting pricing strategies, controlling expenses, or exploring new revenue streams.
External stakeholders, including investors and lenders, often rely on this report to assess the company’s financial health and stability.
Key Data Points Cover the Profit and Loss Statement
- Revenue: Total income generated from sales of goods or services.
- Cost of Goods Sold (COGS): Direct costs associated with producing goods or services.
- Gross Profit: Revenue minus COGS, representing the essential profitability before operating expenses.
- Operating Expenses: Costs incurred in the day-to-day operations of the business, such as rent, utilities, salaries, and marketing.
- Net Profit (or Loss): The final result after subtracting operating expenses from the gross profit.
Practical Applications of Profit and Loss Statement
Regarding performance assessment, business owners leverage P&L to analyze trends in revenue, gross profit margins, and net profit. It provides valuable insights into the company’s overall financial health.
This analysis aids in making informed decisions about future strategies and goals. The P&L also proves instrumental in expense management. It allows owners to scrutinize operating expenses and identify areas for cost reduction or optimization, ultimately contributing to improved profitability.
Furthermore, the P&L serves as a foundational tool for budgeting and forecasting. It enables businesses to set realistic financial goals and monitor progress over time.
Lastly, when communicating with stakeholders, whether seeking investments or loans, business owners can utilize the Profit and Loss Statement to convey the company’s financial standing when communicating with stakeholders. It provides potential investors or lenders with a comprehensive overview of its fiscal performance.
2. Balance Sheet
The Balance Sheet is a fundamental financial report that gives business owners a snapshot of the company’s financial position at a specific time. Unlike the Profit and Loss Statement, which covers a period, the Balance Sheet focuses on the business’s assets, liabilities, and equity as of a specific date. The importance of this report lies in its ability to illustrate the company’s overall financial health and solvency.
Key Data Points Covered in the Balance Sheet
Current Assets: Items expected to be converted into cash or used up within one year, such as cash, accounts receivable, and inventory.
Fixed Assets: Long-term assets like property, plant, and equipment.
Liabilities
Current Liabilities : Obligations due within one year, such as accounts payable and short-term debt.
Long-Term Liabilities: Debts and obligations extending beyond one year.
Owner’s Equity : Represents the owner’s investment in the business, including retained earnings.
Practical Applications of Balance Sheets
The Balance Sheet is beneficial for numerous business situations where good financial management is needed. Business owners use it to thoroughly analyze their company’s liquidity, solvency, and overall financial health.
Critical indicators of short-term solvency include the current asset-to-current liability ratio. The Balance Sheet also helps owners make knowledgeable choices about debt management and financing strategies by analyzing the long-term debt-to-equity ratio.
Beyond internal use, investors use the Balance Sheet to evaluate a company’s financial stability and long-term growth potential, guiding their investment decisions. Furthermore, creditors use the Balance Sheet to assess a company’s creditworthiness, which influences decisions about credit terms and interest rates when making loans.
3. Cash Flow Statement
The Cash Flow Statement is a vital financial report that illustrates the inflow and outflow of cash into and out of business during a specific period. It gives business owners a detailed understanding of how operational, investing and financing activities impact the company’s liquidity.
The primary goal of the Cash Flow Statement is to help business owners manage their cash effectively. This ensures the company has enough funds to meet its obligations and capitalize on opportunities.
Key Data Points Covered in Cash Flow Statement
Operating activities.
Cash from Customers: This represents cash generated from sales.
Paid to Suppliers and Employees: Reflects the cash outflows related to operating expenses.
Investing Activities
Cash from the Sale of Assets: Indicates cash generated from the sale of long-term assets.
Used for Asset Purchases: Reflects cash outflows for acquiring long-term assets.
Financing Activities
Cash from Borrowing or Issuing Stock: This represents cash received from loans or stock issuances.
Used for Debt Repayment and Dividends: Reflects cash outflows for repaying debt or paying dividends.
Practical Applications of Cash Flow Statements
The Cash Flow Statement is essential for practical financial applications in business. Business owners use it to conduct effective liquidity planning, anticipate periods of cash surplus or shortage, and facilitate proactive management.
By analyzing cash flows from investing activities, owners can make well-informed choices about capital expenditures and asset sales, contributing to sound investment strategies. Furthermore, the Cash Flow Statement helps with debt management by evaluating the company’s ability to generate cash for timely debt repayment.
As a fundamental tool for forecasting and budgeting, it helps business owners plan for future financial needs by providing a comprehensive overview of cash movements and ensuring a proactive approach to financial decision-making.
In essence, the Cash Flow Statement aids in promoting financial stability, guiding investment decisions, and facilitating strategic planning for long-term business growth.
4. Aged Receivables Report
The Aged Receivables Report is a detailed account of outstanding customer invoices organized by the time they have been overdue. This report is essential for business owners as it provides a snapshot of the company’s accounts receivable aging.
In addition, it helps to track and manage the timely collection of customer payments. The primary goal of this report is to enhance cash flow by promptly identifying and addressing overdue receivables.

Key Data Points Covered on Aged Receivables Report
Customer details.
Customer Names: Identifies customers with outstanding invoices.
Contact Information: Enables efficient communication with customers for payment follow-ups.
Invoice Information
Invoice Amounts: Displays the amounts due for each outstanding invoice.
Due Dates: Indicates the due dates of invoices to track aging.
Practical Applications of Aged Receivables Report
The Aged Receivables Report proves invaluable in various practical applications for business owners. Primarily, it facilitates collection management by allowing owners to prioritize efforts based on the age and significance of overdue invoices. This strategic approach helps focus on older and more critical outstanding payments.
Furthermore, the report aids in cash flow forecasting by analyzing overdue invoices, enabling owners to estimate the expected timing of payments. In evaluating credit policies, the Aged Receivables Report provides insights into their effectiveness and identifies customers with a history of delayed payments, guiding adjustments for better credit risk management.
As a communication tool, it fosters discussions with customers about outstanding invoices, contributing to amicable resolutions of payment issues and reinforcing positive relationships.
Therefore, the Aged Receivables Report is a multifaceted tool that enhances collection efficiency, supports financial forecasting, and fosters effective credit policy management and customer communication.
5. Aged Payables Report
The Aged Payables Report is a comprehensive record of outstanding vendor bills organized by the time they have been unpaid. This report is vital for business owners as it provides a detailed overview of the company’s accounts payable aging, facilitating effective management of supplier payment obligations.
The primary goal of this report is to ensure timely vendor payments, maintain positive supplier relationships, and manage cash flow efficiently.
Key Data Points Covered in the Aged Payables Report
Vendor details.
Vendor Names: Identifies vendors with outstanding bills.
Contact Information: Enables efficient communication with vendors regarding payment status.
Bill Information
Bill Amounts: Displays the amounts due for each outstanding bill.
Due Dates: Indicates the due dates of bills to track aging.
Practical Applications of Aged Payables Report
Regarding practical financial management, the Aged Payables Report is a valuable tool for business owners. One of its primary applications is payment prioritization, which allows owners to focus on bills that are approaching or have already passed their due dates to avoid late fees.
This strategic approach ensures timely payments and helps with cash flow management. The report’s analysis of outstanding bills makes it useful for cash flow forecasting, giving owners a precise estimate of upcoming cash outflows and facilitating proactive planning for adequate liquidity.
Furthermore, the Aged Payables Report is a valuable asset in vendor negotiations. It allows owners to secure favorable payment terms based on past payment patterns and current business requirements.
In the broader sense of financial planning, it provides insights into upcoming financial obligations. This allows owners to allocate resources more efficiently and confidently.
6. Budget vs. Actuals Report
The Budget vs. Actuals Report is a financial analysis tool that compares budgeted amounts with the actual financial performance of a business over a specified period. Business owners use this report to evaluate how closely their financial results align with budgeted expectations.
The importance of this report lies in its ability to provide insights into budget adherence. It enables owners to identify areas of overperformance or underperformance and make informed adjustments to achieve financial goals.
Key Data Points Covered in Budget and Actual Report
Budgeted amounts.
Revenue: Planned income from sales or services.
Expenses: Projected costs associated with operations, including salaries, utilities, and marketing.
Actual Financial Performance
Actual Revenue: Realized income from sales or services.
Actual Expenses: Incurred costs during the reporting period.
Positive Variances: Instances where actual performance exceeds the budgeted amounts.
Negative Variances: Instances where actual performance falls short of the budgeted amounts.
Practical Applications of Budget and Actual Reports
Budget vs. Actuals Report provides a comprehensive view of financial performance. It allows owners to identify areas where the business has exceeded or fallen short of expectations. This performance analysis helps identify areas for improvement or recognize achievements.
Furthermore, the report makes forecast adjustments based on variance analysis, allowing owners to fine-tune future budgets for more accurate planning. Regarding cost control, it acts as a guiding beacon, highlighting areas where actual expenses exceed budget.
Positive variances, on the other hand, can indicate revenue growth opportunities. It guides owners to optimize successful strategies and capitalize on profitable initiatives.
7. Sales by Customer Report
The Sales by Customer Report provides a thorough analysis of a company’s sales performance by individual customers. This report provides insights into customer-specific sales trends for business owners. This allows them to identify top-performing clients and areas for improvement in their customer base.
The primary goal of this report is to optimize sales strategies and enhance customer relationships. Moreover, maximize revenue by tailoring marketing and service efforts to specific customer needs.
2. Key Data Points Covered of Sales by Customer Report
Customer Names: Identifies individual customers for analysis.
Contact Information: Enables targeted communication with customers.
Total Sales: The overall sales amount attributed to each customer.
Product/Service Breakdown: Break down sales by specific products or services.
Practical Applications of Sales by Customer Report
Regarding valuable business insights, the Sales by Customer Report is essential for business owners. It can be used for many parts of customer relationship management, from dividing customers into groups based on how they buy things to.
This segmentation enables targeted marketing strategies and personalized services to improve customer satisfaction. The report can also be used for revenue concentration analysis. It helps business owners find their best customers and determine the concentration of their revenue sources.
This insight is significant for expanding the customer base and ensuring long-term stability. The report also helps with upselling and cross-selling by showing how customers usually buy things, which increases sales chances.
Finally, when business owners deeply understand how each customer performs in sales, they can develop effective strategies for keeping good customers and addressing concerns about bad ones.
8. Expense by Vendor Summary
The Expense by Vendor Summary is a financial report that provides a condensed overview of a business’s expenses categorized by vendor. This report holds significant importance for business owners as it allows them to analyze and manage their expenditures efficiently.
The primary goal of this report is to facilitate vendor management and negotiation. It provides insights into spending patterns and helps owners make informed decisions to optimize costs.
Key Data Points Covered of Expense by Vendor Summary
Vendor Names: Identifies each vendor associated with business expenses.
Contact Information: Provides vendor contact details for efficient communication.
Expense Data
Total Expenses: The overall amount spent with each vendor during the specified period.
Expense Categories: Break down expenses into categories such as utilities, supplies, services, etc.
Practical Applications of Expense by Vendor Summary
The Expense by Vendor Summary is an essential tool for business owners in strategic financial management. One of its primary applications is vendor performance evaluation, which allows owners to evaluate vendors based on spending patterns, the quality of goods or services, and contractual compliance.
This evaluation serves as the foundation for a strong negotiation strategy. Owners equipped with the report’s insights can discuss with vendors to secure better terms, whether through discounts, extended payment terms, or favorable pricing for bulk purchases.
In addition, the report helps with budget alignment by clearly showing spending patterns. It allows owners to make realistic financial projections and allocate resources more effectively in future budgets.
Furthermore, the Expense by Vendor Summary aids in cost control by identifying vendors with high expenses, allowing owners to explore alternative suppliers or negotiate better rates to optimize overall expenditures.
9. Bank Reconciliation Report
The Bank Reconciliation Report is a financial statement that aids in reconciling a company’s bank statements with the financial records in QuickBooks. This report is crucial for business owners as it ensures accuracy in financial transactions, highlighting discrepancies between the company’s and the bank’s records.
The primary goal of this report is to identify and rectify any errors or omissions in the financial data, ultimately ensuring the integrity of the company’s financial statements.
Key Data Points Covered in Bank Reconciliation Report
Bank statement details.
Beginning and Ending Balances: The starting and ending balances as per the bank statement.
Deposits and Withdrawals: Details of deposits made into the bank account and withdrawals made from the account during the specified period.
QuickBooks Records
Beginning and Ending Balances: The corresponding QuickBooks balances at the start and end of the reconciliation period.
Recorded Transactions: A list of transactions in QuickBooks during the reconciliation period.
Practical Applications of Bank Reconciliation Report
One practical application of a bank reconciliation report is error detection and correction. It is essential because the report helps owners identify discrepancies between QuickBooks records and bank statements, allowing them to correct errors immediately.
Furthermore, regular reconciliation serves as an essential control mechanism for fraud prevention. It assists in detecting potential unauthorized transactions and improving the overall security of financial transactions.
In terms of financial management, accurate reconciliation ensures that the company’s cash position is accurately reflected, thereby facilitating effective cash flow management and comprehensive financial planning.
Furthermore, the report is critical in maintaining the integrity of financial statements, as it assures stakeholders, including investors and creditors, about the accuracy of the company’s financial reporting. Therefore, the Bank Reconciliation Report is the foundation for financial accuracy, security, and transparency.
10. Job Profitability Report
The Job Profitability Report is a financial document that analyzes the profitability of specific jobs or projects within a business. This report holds significant importance for business owners, especially those involved in project-based industries. This report offers insights into the financial performance of individual projects.
The report aims to aid in project management and pricing decisions. This allows owners to optimize resource allocation, set competitive pricing, and maximize overall profitability.
Key Data Points Covered in Job Profitability Report
Job or project details.
Project Names: Identifies individual projects or jobs for analysis.
Client Information: Provides client details for communication and relationship management.
Financial Performance Metrics
Total Revenue: The overall income generated from each project.
Total Costs: The comprehensive costs associated with each project, including direct and indirect expenses.
Profit Margin: The percentage of profit earned on each project.
Practical Applications of Job Profitability Report
The Job Profitability Report is an essential tool for business owners involved in project-based work, providing numerous benefits for performance evaluation and strategic decision-making. Owners use this report to assess each project’s financial success, identify areas for improvement, and implement strategies to increase overall profitability.
The report enables optimal resource allocation by providing a detailed analysis of project costs, ensuring that the right resources are assigned to projects with the highest potential for profitability.
Furthermore, the report helps with pricing decisions, allowing owners to make informed decisions about competitive pricing strategies that cover costs while generating desired profit margins.
Beyond financial considerations, understanding the profitability of each project contributes to effective client relationship management, allowing owners to cultivate relationships with clients who share the company’s financial goals.
Therefore, the Job Profitability Report is a comprehensive tool for driving performance improvement, resource optimization, strategic pricing, and building positive client relationships.
11. Inventory Valuation Summary
The Inventory Valuation Summary is a financial report that offers a comprehensive overview of the current value of a business’s inventory. This report is important to business owners, especially those involved in retail or manufacturing. The report assists in managing and planning inventory effectively.
The inventory valuation summary’s primary goal is to provide insight into the financial status of the inventory. It helps owners make informed decisions about stock levels, pricing, and overall inventory management strategies.
Key Data Points Covered in Inventory Valuation Summary
Inventory details.
Item Names : Identifies individual inventory items.
Quantity on Hand: The number of units of each item currently in stock.
Financial Metrics
Total Value: The overall financial value of the inventory, calculated based on the quantity on hand and the unit cost.
Cost of Goods Sold (COGS): The accumulated cost of goods that have been sold, providing insight into the financial impact of sales.
Practical Applications of Inventory Valuation Summary
The Inventory Valuation Summary is a valuable tool for business owners who want to manage their inventory effectively. Its applications are broad, beginning with inventory optimization, in which owners use the report to ensure that stock levels match market demand while minimizing holding costs.
Understanding individual item values allows for implementing pricing strategies that balance increasing profit margins with remaining competitive in the market. Furthermore, the report helps to identify slow-moving or obsolete inventory, allowing owners to take proactive measures like discounts, promotions, or write-offs to improve inventory turnover.
Aside from operational considerations, data from the Inventory Valuation Summary helps to ensure accurate financial reporting by properly accounting for inventory in balance sheets and profit and loss statements.
In short, this report is essential for maintaining optimal inventory levels, implementing effective pricing strategies, and ensuring accurate financial reporting for overall business success.
12. Employee Earnings Summary
The Employee Earnings Summary is a critical QuickBooks report that summarizes employee earnings, taxes, and deductions. It holds immense importance for business owners as it assists in streamlined payroll management.
The employee earning summary report’s primary goal is to offer a consolidated overview of employee compensation. It aids in accurate financial record-keeping and compliance with tax regulations.
Key Data Points Covered in the Employee Earnings Summary
Employee details.
Employee Names: Identifies individual employees for payroll management.
Employee Identification Numbers: Provides unique identifiers for accurate record-keeping.
Financial Components
Gross Earnings: The total earnings before deductions.
Taxes Withheld: Details of federal, state, and other taxes withheld from employee pay.
Deductions: Summarizes various deductions such as health insurance, retirement contributions, etc.
Practical Applications of Employee Earnings Summary
The Employee Earnings Summary is a critical tool for business owners, as it is essential for several aspects of effective payroll management. Owners primarily use this report to ensure the accuracy of payroll processing, thereby minimizing errors in employee compensation.
Beyond payroll accuracy, the report is critical to meeting tax compliance requirements by detailing tax withholdings and assisting business owners in fulfilling their tax obligations accurately and efficiently.
It also serves as a communication tool for employees. It provides a transparent and detailed overview of earnings, taxes, and deductions, promoting financial clarity. The Employee Earnings Summary also helps to maintain a comprehensive record of employee financial data, ensuring organized and accurate documentation for compliance and auditing purposes.
13. Statement of Cash Flows
The Statement of Cash Flows in QuickBooks is a comprehensive financial report that analyzes a business’s cash flow activities over a specific period. This report is of utmost importance for business owners as it offers a deeper understanding of how cash moves in and out of the business, categorized into operating, investing, and financing activities.
The primary goal of the Statement of Cash Flows is to enhance financial transparency and assist owners in making informed decisions about cash management, investment, and financing.
Key Data Points Covered in the Statement of Cash Flow
Cash from Customers: Represents cash generated from sales.
Paid to Suppliers and Employees: Reflects cash outflows related to operating expenses.
Cash from Sale of Assets: Indicates cash generated from the sale of long-term assets.
Cash from Borrowing or Issuing Stock: Represents cash received from loans or stock issuances.
Cash Used for Debt Repayment and Dividends: Reflects cash outflows for repaying debt or paying dividends.
Practical Applications Statement of Cash Flow
The Statement of Cash Flow is an essential tool for business owners. It plays a vital role in many aspects of financial management. First and foremost, owners use it to manage and forecast cash flow effectively, ensuring enough liquidity to meet financial obligations.
The report is invaluable regarding investment decisions because it helps owners assess the impact of investment activities on cash flow, allowing for more strategic capital expenditure decisions.
Furthermore, the Statement of Cash Flows aids in debt management. It allows owners to analyze cash flows related to financing activities and make informed decisions about debt repayment and new debt issuance.
Moreover, it serves as a tool for communicating with stakeholders by providing a clear and comprehensive picture of the company’s cash flow activities and overall financial health.
Therefore, the Statement of Cash Flows is a valuable asset that guides effective cash flow management, supports strategic investments and debt decisions, and facilitates open communication with stakeholders.
14. Customer Sales by Item Detail
The Customer Sales by Item Detail report in QuickBooks is a specialized analysis tool that breaks down sales by specific products or services, providing business owners with detailed insights into the performance of individual offerings.
This report holds significant importance for business owners as it facilitates a granular understanding of product or service sales. Thus, it aids in strategic inventory management, pricing, and marketing decision-making.
The primary goal is to help owners identify top-performing offerings and optimize their product or service mix for maximum profitability.
Key Data Points Covered of Customer Sales by Item Detail
Product/service details.
Item Names: Identifies individual products or services for analysis.
Description: Provides additional information about each item for clarity.
Quantity Sold: Indicates the units sold for each product or service.
Total Sales: Represents the amount of overall sales generated by each item.
Practical Applications of Customer Sales by Item Detail
The Customer Sales by Item Detail report is an invaluable resource for business owners making strategic decisions. Its applications are diverse, beginning with product mix optimization. Business owners use the report to focus resources on offerings that generate the most sales and profitability. Thus resulting in a more streamlined and profitable product or service mix.
Furthermore, the report helps to adjust pricing strategies by revealing which items are more price-sensitive or have a higher perceived value for customers. Thus guiding owners in strategic pricing decisions.
In addition, analyzing the quantity sold for each item aids in effective inventory planning, allowing owners to maintain optimal stock levels while avoiding issues such as stockouts or excess inventory.
Furthermore, the report serves as a valuable tool for targeted marketing campaigns, allowing owners to promote specific products or services based on popularity and customer demand, thereby increasing the efficiency and impact of marketing efforts.
Therefore, the Customer Sales by Item Detail report is a must-have tool for business owners looking to optimize product mix and price strategically, manage inventory efficiently, and run targeted marketing campaigns.
15. Vendor Expenses by Item Summary
The Vendor Expenses by Item Summary report in QuickBooks provides business owners with a summarized view of expenses incurred with specific vendors, categorized by products or services. This report is important as it aids in cost analysis and pricing decisions. The vendor expenses by item summary’s primary goal is to offer owners insights into their expenditure patterns with individual vendors. It enables business owners to make informed decisions about cost management, vendor relationships, and pricing strategies.
Key Data Points Covered in the Vendor Expenses by Item Summary
Vendor Names: Identifies individual vendors for analysis.
Contact Information: Provides vendor contact details for communication and relationship management.
Total Expenses: The sum of the costs associated with each vendor’s goods or services.
Practical Applications of Vendor Expenses by Item Summary
The Vendor Expenses by Item Summary report is a valuable resource for business owners involved in strategic financial management. Its applications are diverse, beginning with cost allocation and analysis, in which owners use the report to allocate costs to specific products or services, allowing for a detailed analysis of spending patterns.
Furthermore, the report serves as a tool for vendor negotiations, providing owners with insights into vendor-specific expenses and assisting in negotiating better terms based on a thorough understanding of these costs.
Regarding pricing strategy adjustments, the report’s insights enable business owners to align product or service prices with associated costs, ensuring maximum profitability. Furthermore, the Vendor Expenses by Item Summary report aids in budgeting and forecasting by providing accurate data on vendor expenses. It enables owners to create realistic financial projections.
Therefore, this report is a versatile tool for allocating costs, improving vendor negotiations, facilitating pricing strategy adjustments, and contributing to effective budgeting and forecasting.
6 Tips for Efficiently Generating and Analyzing Reports in Quickbooks
Tip 1: customize reports to your business needs.
One of the key features of QuickBooks is its flexibility in generating reports tailored to specific business needs. Take advantage of this by customizing reports based on your unique requirements.
Adjust columns, date ranges, and filters to focus on the most relevant information for your analysis. By tailoring reports to your business, you can extract insights directly applicable to your operations, financial goals, and strategic decision-making.
Tip 2: Save Custom Report Settings
Once you’ve fine-tuned a report to match your preferences, save those settings as a template. This feature allows you to create a customized report template that can be easily accessed and reused for future reports.
In addition, saving custom report settings saves time and ensures consistency in your reporting process. It’s a practical way to maintain a standardized approach to reporting, especially when dealing with similar data sets over time.
Tip 3: Utilize Report Groups
QuickBooks offers the convenience of organizing related reports into groups. This feature is handy when dealing with multiple reports simultaneously or analyzing various aspects of your business.
By grouping related reports together, you can streamline your reporting process, making it more efficient and organized. This is particularly beneficial for businesses that regularly analyze different facets of their operations and need quick access to a range of reports for comprehensive insights. Grouping reports enhances overall efficiency and accessibility in managing your financial data.
Tip 4: Automate Recurring Reports
Automating recurring reports is a time-saving strategy in QuickBooks. Take advantage of the automated scheduling feature for reports requiring regular review. QuickBooks allows you to set up schedules for generating and delivering reports at specified intervals. It eliminates the need for manual intervention in routine reporting tasks. This ensures that crucial information is consistently delivered on time, freeing your time for more strategic analysis and decision-making.
Tip 5: Master Key Shortcuts and Commands
Efficiency in navigating and generating reports can be significantly enhanced by mastering key shortcuts and commands within QuickBooks. Learn and use keyboard shortcuts that align with your reporting needs.
These shortcuts expedite common tasks, making the reporting process more streamlined and reducing the time spent on manual inputs. Familiarizing yourself with these commands can improve your overall workflow, enabling you to access and generate reports quickly and with greater ease.
Tip 6: Take Advantage of Drill-Down Features
QuickBooks provides a powerful drill-down feature that allows you to explore specific transactions directly from summary reports. Utilize this feature to investigate the details behind the numbers presented in your reports.
By drilling down into the underlying transactions, you can gain a deeper understanding of your financial data, identify trends, and pinpoint areas requiring closer scrutiny. This feature enhances your ability to analyze and interpret financial information, providing valuable insights for informed decision-making.
What Are the Potential Challenges in Using QuickBooks Bookkeeping Reports?
Using QuickBooks bookkeeping reports can greatly streamline financial management, but like any tool, it has challenges. Here are six potential challenges using QuickBooks bookkeeping reports:
The Complexity of Customization
QuickBooks offers a range of customizable reports, but the complexity of customization can pose a challenge for users unfamiliar with the software’s intricacies. Configuring reports to meet specific business needs may require a learning curve, and users might find navigating the customization options difficult.
Data Entry Errors
The accuracy of QuickBooks bookkeeping reports heavily relies on the accuracy of data entry. Human errors, such as entering incorrect amounts or selecting the wrong account categories, can lead to reporting inaccuracies. Without careful validation and review, these errors can compromise the reliability of financial information.
Limited Real-time Updates
QuickBooks may not always provide real-time updates, especially in multi-user environments. This lag in data synchronization can challenge businesses that require instant access to the most current financial information. Users must be mindful of potential delays in data updates, particularly when making critical business decisions.
Inadequate Training and Support
The full potential of QuickBooks bookkeeping reports may not be realized without proper training. Users not adequately trained in the software might struggle to navigate its features and utilize reports effectively. Additionally, inadequate customer support can exacerbate challenges, making it difficult to resolve issues promptly.
Compatibility and Integration Issues
QuickBooks may face compatibility issues with other software or third-party applications that businesses use for different purposes. Integrating QuickBooks with other tools seamlessly can be challenging, and businesses might encounter technical difficulties that hinder the smooth flow of data between systems.
Security Concerns
As financial data is sensitive, ensuring the security of QuickBooks files is paramount. Challenges may arise in implementing robust security measures, including user access controls and data encryption. Inadequate security measures could expose businesses to the risk of unauthorized access, data breaches, or the loss of sensitive financial information.
The Future Trends in QuickBooks Reporting
As technology advances, the landscape of financial management tools, including QuickBooks, is evolving to meet the ever-changing needs of businesses. The future of QuickBooks reporting holds promising developments that aim to enhance the user experience, provide deeper insights, and streamline financial processes.
One notable trend is integrating artificial intelligence (AI) and machine learning (ML) into reporting functionalities. This infusion of intelligent technologies is expected to automate data analysis, identify patterns, and offer predictive insights, making financial decision-making more proactive and strategic.
Furthermore, increased customization options, improved user interfaces, and enhanced data visualization are on the horizon, ensuring businesses can tailor their reports to specific requirements while making data interpretation more intuitive.
How Can Businesses Prepare for the Future of QuickBooks Reporting?
To harness the full potential of future QuickBooks reporting features, businesses must proactively prepare for the upcoming changes. Here are some essential steps to consider:
1. Stay Informed and Educated
Keep abreast of updates and new features in QuickBooks. Regularly engage with official communications, attend training sessions, and explore educational resources provided by QuickBooks to stay informed about emerging trends and functionalities.
2. Invest in Training and Skill Development
As reporting features evolve, ensure your team is equipped with the necessary skills to navigate and leverage new functionalities. Investing in ongoing training will empower your staff to maximize the benefits of advanced reporting tools.
3. Optimize Data Quality
The effectiveness of future reporting tools relies on the quality of the underlying data. Establish and maintain robust data management practices to ensure accuracy and consistency in your financial records. Clean, reliable data will be crucial for deriving meaningful insights.
4. Embrace Automation
With the integration of AI and ML, the future of QuickBooks reporting will likely emphasize automation. Businesses should embrace these technologies to automate routine tasks, data analysis, and reporting processes. This increases efficiency and allows staff to focus on more strategic aspects of financial management.
5. Review and Adjust Reporting Processes
Take the opportunity to review and adjust your current reporting processes. Consider whether your existing reports align with your evolving business goals and explore how new features can be incorporated to enhance decision-making.
6. Collaborate with Financial Professionals
Engage with financial professionals and experts in QuickBooks reporting. Collaborating with specialists can provide valuable insights into best practices, industry benchmarks, and innovative ways to leverage emerging features for your specific business needs.
The Pros and Cons of Quickbook
QuickBooks is a popular accounting software offering a range of business features. It makes financial management more efficient. However, like any software, it comes with its own set of pros and cons.
Pros of QuickBooks
User-friendly interface.
QuickBooks is known for its user-friendly interface, making it accessible to users with varying levels of accounting expertise. The intuitive design allows users to navigate the software easily.
Comprehensive Features
QuickBooks offers comprehensive features, including invoicing, expense tracking, payroll processing, financial reporting, and more. This breadth of functionality makes it a one-stop solution for many small and medium-sized businesses.
Time-Saving Automation
The automation features in QuickBooks can significantly reduce manual data entry and repetitive tasks. This includes features such as bank reconciliation, which automates the process of matching transactions with bank statements.
Integration Capabilities
QuickBooks integrates seamlessly with various third-party applications, allowing businesses to connect their accounting software with other tools they use for CRM, e-commerce, and more.
Scalability
QuickBooks is scalable, catering to the needs of both small startups and larger enterprises. Users can choose from different versions of the software based on the size and requirements of their business.
Cloud-Based Accessibility
QuickBooks Online, the cloud-based version, allows users to access their financial data from anywhere with an internet connection. This is particularly beneficial for businesses with remote or mobile workforces.
Cons of QuickBooks
While QuickBooks offers different pricing plans, the cost of the software may be a concern for some small businesses, especially those with limited budgets. Additional costs for add-ons and support services can contribute to the overall expense.
Learning Curve
Despite its user-friendly design, there can be a learning curve for individuals unfamiliar with accounting principles or software. Training may be necessary to maximize the use of QuickBooks’ features.
Limited Customization
Some users find the customization options in QuickBooks limited. Businesses with unique or complex needs may find that the software doesn’t fully align with their specific requirements.
Storing financial data in the cloud may raise security concerns for some users. While QuickBooks employs security measures, businesses should still implement best practices for data protection.
Not Ideal for Large Businesses with Complex Needs
While QuickBooks is scalable, larger enterprises with complex accounting requirements may find that the software lacks certain advanced features that specialized enterprise-level solutions offer.
Dependency on Internet Connection
QuickBooks Online relies on an internet connection, and users may face challenges if they experience internet outages or have limited access. This can be a drawback for businesses operating in areas with unreliable internet connectivity.
Mastering QuickBooks For Bookkeeping Reports—Conclusion
In conclusion, mastering QuickBooks and leveraging its top 15 bookkeeping reports can be a game changer for businesses looking to improve their financial efficiency and strategic decision-making.
These reports’ comprehensive insights enable users to accurately track income and expenses, monitor cash flow, and analyze profitability. Understanding the complexities of QuickBooks bookkeeping reports allows users to improve their financial management, streamline processes, and pave the way for informed business growth.
Whether you’re a small business owner, an accountant, or a financial manager, investing time in learning and utilizing these reports can improve your financial knowledge and significantly contribute to your company’s success.
With QuickBooks on your side and these valuable reports at your fingertips, you’re well-equipped to navigate the complexities of bookkeeping and make well-informed choices based on data that propels your business forward.
Mastering QuickBooks For Bookkeeping Reports—Frequently Asked Questions
Which is more important: bookkeeping or accounting.
Both bookkeeping and accounting play crucial roles in managing a company’s financial health, but they serve distinct purposes. Bookkeeping involves recording daily transactions, organizing receipts, and maintaining financial records.
In addition, it lays the foundation for accurate financial reporting. On the other hand, accounting encompasses a broader spectrum of analyzing and interpreting the financial data provided by bookkeeping.
While bookkeeping is the systematic recording of financial transactions, accounting involves interpreting, summarizing, and communicating the financial information for decision-making. Both are integral components of sound financial management, with bookkeeping laying the groundwork for effective accounting.
What is the purpose of bookkeeping?
The primary purpose of bookkeeping is to record and organize financial transactions systematically. Bookkeepers document income, expenses, assets, and liabilities, creating a business’s detailed and accurate financial trail.
This organized data is crucial for various purposes, such as preparing financial statements, tax filings, and complying with regulatory requirements.
Bookkeeping provides a clear financial picture of a business, enabling informed decision-making, budgeting, and planning for future growth. Essentially, it is the backbone of financial management, ensuring transparency and accountability in a company’s financial operations.
Which is the most important feature of bookkeeping?
Accuracy is arguably the most important feature of bookkeeping. The meticulous recording of financial transactions with precision ensures that the financial statements and reports generated from this data are reliable and trustworthy.
Errors in bookkeeping can lead to misinformation, potentially causing financial mismanagement and compliance issues. Maintaining accuracy in recording transactions is vital for making informed decisions, presenting accurate financial statements to stakeholders, and fostering the overall financial health of a business.
What does QuickBooks bookkeeping do?
QuickBooks bookkeeping software streamlines and automates the bookkeeping process for businesses. It allows users to easily record transactions, categorize expenses, and generate financial reports.
QuickBooks facilitates efficient management of accounts receivable and payable, helps track inventory, and automates payroll processes. The software’s user-friendly interface and robust features make it a powerful tool for small to medium-sized businesses.
Overall, QuickBooks bookkeeping simplifies complex financial tasks, saving time and improving the accuracy of financial data.
Mastering QuickBooks: The Top 10 Most Valuable QuickBooks Bookkeeping Reports – Recommended Readings
External Links:
5 QuickBooks Online Reports Every Business Owner Should Be Using
11 tips to optimize QuickBooks reporting
10 Major Advantages Of QuickBooks For Your Business
Internal Links:
The Top 19 Accounting Trends in 2024
Quickbooks in Manufacturing- When is it Time to Move On to a Better System?
The Best Bookkeeping Practices for Small Businesses – Stay on Top of Your Finances
Meet The Author
Stephanie Encabo
Related posts.

Accounting Career in a City vs Small Town: Pros and Cons
When considering an accounting career, the choice between a city and a small town is crucial. In a city, accountants can benefit from diverse job opportunities, higher salaries, and networking events. On the other hand, small towns offer a tight-knit community, lower living costs, and a better work-life balance.

How Can Diversity of Thought Lead to Good Ethical Decisions?
Diversity of thought, or cognitive diversity, encompasses varied perspectives and beliefs. Embracing this diversity leads to better ethical decision-making by broadening perspectives, enhancing critical thinking, mitigating groupthink, fostering cultural competence, strengthening stakeholder engagement, promoting ethical leadership, improving risk management, and fostering employee engagement.

17 Best US Cities for Accountants (With Salaries)
When choosing a city for your accounting career, consider factors like cost of living, job market, industry focus, networking potential, and lifestyle preferences. Top US cities for accountants include Washington D.C., New York City, Denver, Los Angeles, Boston, Chicago, and Dallas-Fort Worth, offering diverse opportunities and vibrant lifestyles.
Subscribe to discover my secrets to success. Get 3 valuable downloads, free exclusive tips, offers, and discounts that we only share with my email subscribers.
Social media.

Quick links
- Terms of Service
Other Pages
Contact indo.
- 302-981-1733
- [email protected]
© Accounting Professor 2023. All rights reserved
Discover more from accounting professor.org.
Subscribe now to keep reading and get access to the full archive.
Type your email…
Continue reading
TechRepublic
Account information.

Share with Your Friends
6 Best Financial Reporting Software for 2024
Your email has been sent

- Best overall financial reporting software: QuickBooks Online
- Most comprehensive reporting: Sage Intacct
- Best for large enterprises: NetSuite
- Best for small businesses: Xero
- Best add-on tool: Spotlight Reporting
- Best automations: Zoho Books
To make evidence-based decisions for your business, you need financial reporting software that makes it possible to import and analyze your financial data and accounting statistics . However, the financial reports of a small business are very different from that of a large enterprise, which can make it tough to find the best financial reporting software for your needs.
To help you narrow down your search, we’ve rounded up the best financial reporting software for businesses of all sizes.
Top accounting software comparison
Besides price, there are many other features to consider when choosing a financial reporting software platform. This chart summarizes some of the main things to look for:
QuickBooks Online: Best overall financial reporting software
QuickBooks is known for its accounting and bookkeeping software, but it actually offers a very robust library of financial reports as well. The entry-level Simple Start plan already comes with dozens of reports, and the Plus plan provides access to more than 60 different reports to choose from. QuickBooks also comes with plenty of other advanced features, including time tracking and inventory management, depending on what plan you decide on.
QuickBooks Online offers four different pricing tiers to choose from:
- QuickBooks Simple Start: $30 per month with access for one user.
- QuickBooks Essentials: $60 per month with access for up to three users.
- QuickBooks Plus: $90 per month with access for up to five users.
- QuickBooks Advanced: $200 per month with access for up to 25 users.
First-time QuickBooks customers can choose to explore QuickBooks without committing to a plan by signing up for a 30-day free trial. You can also skip the free trial in favor of locking in 50% off for your first three months — but you can’t choose both.
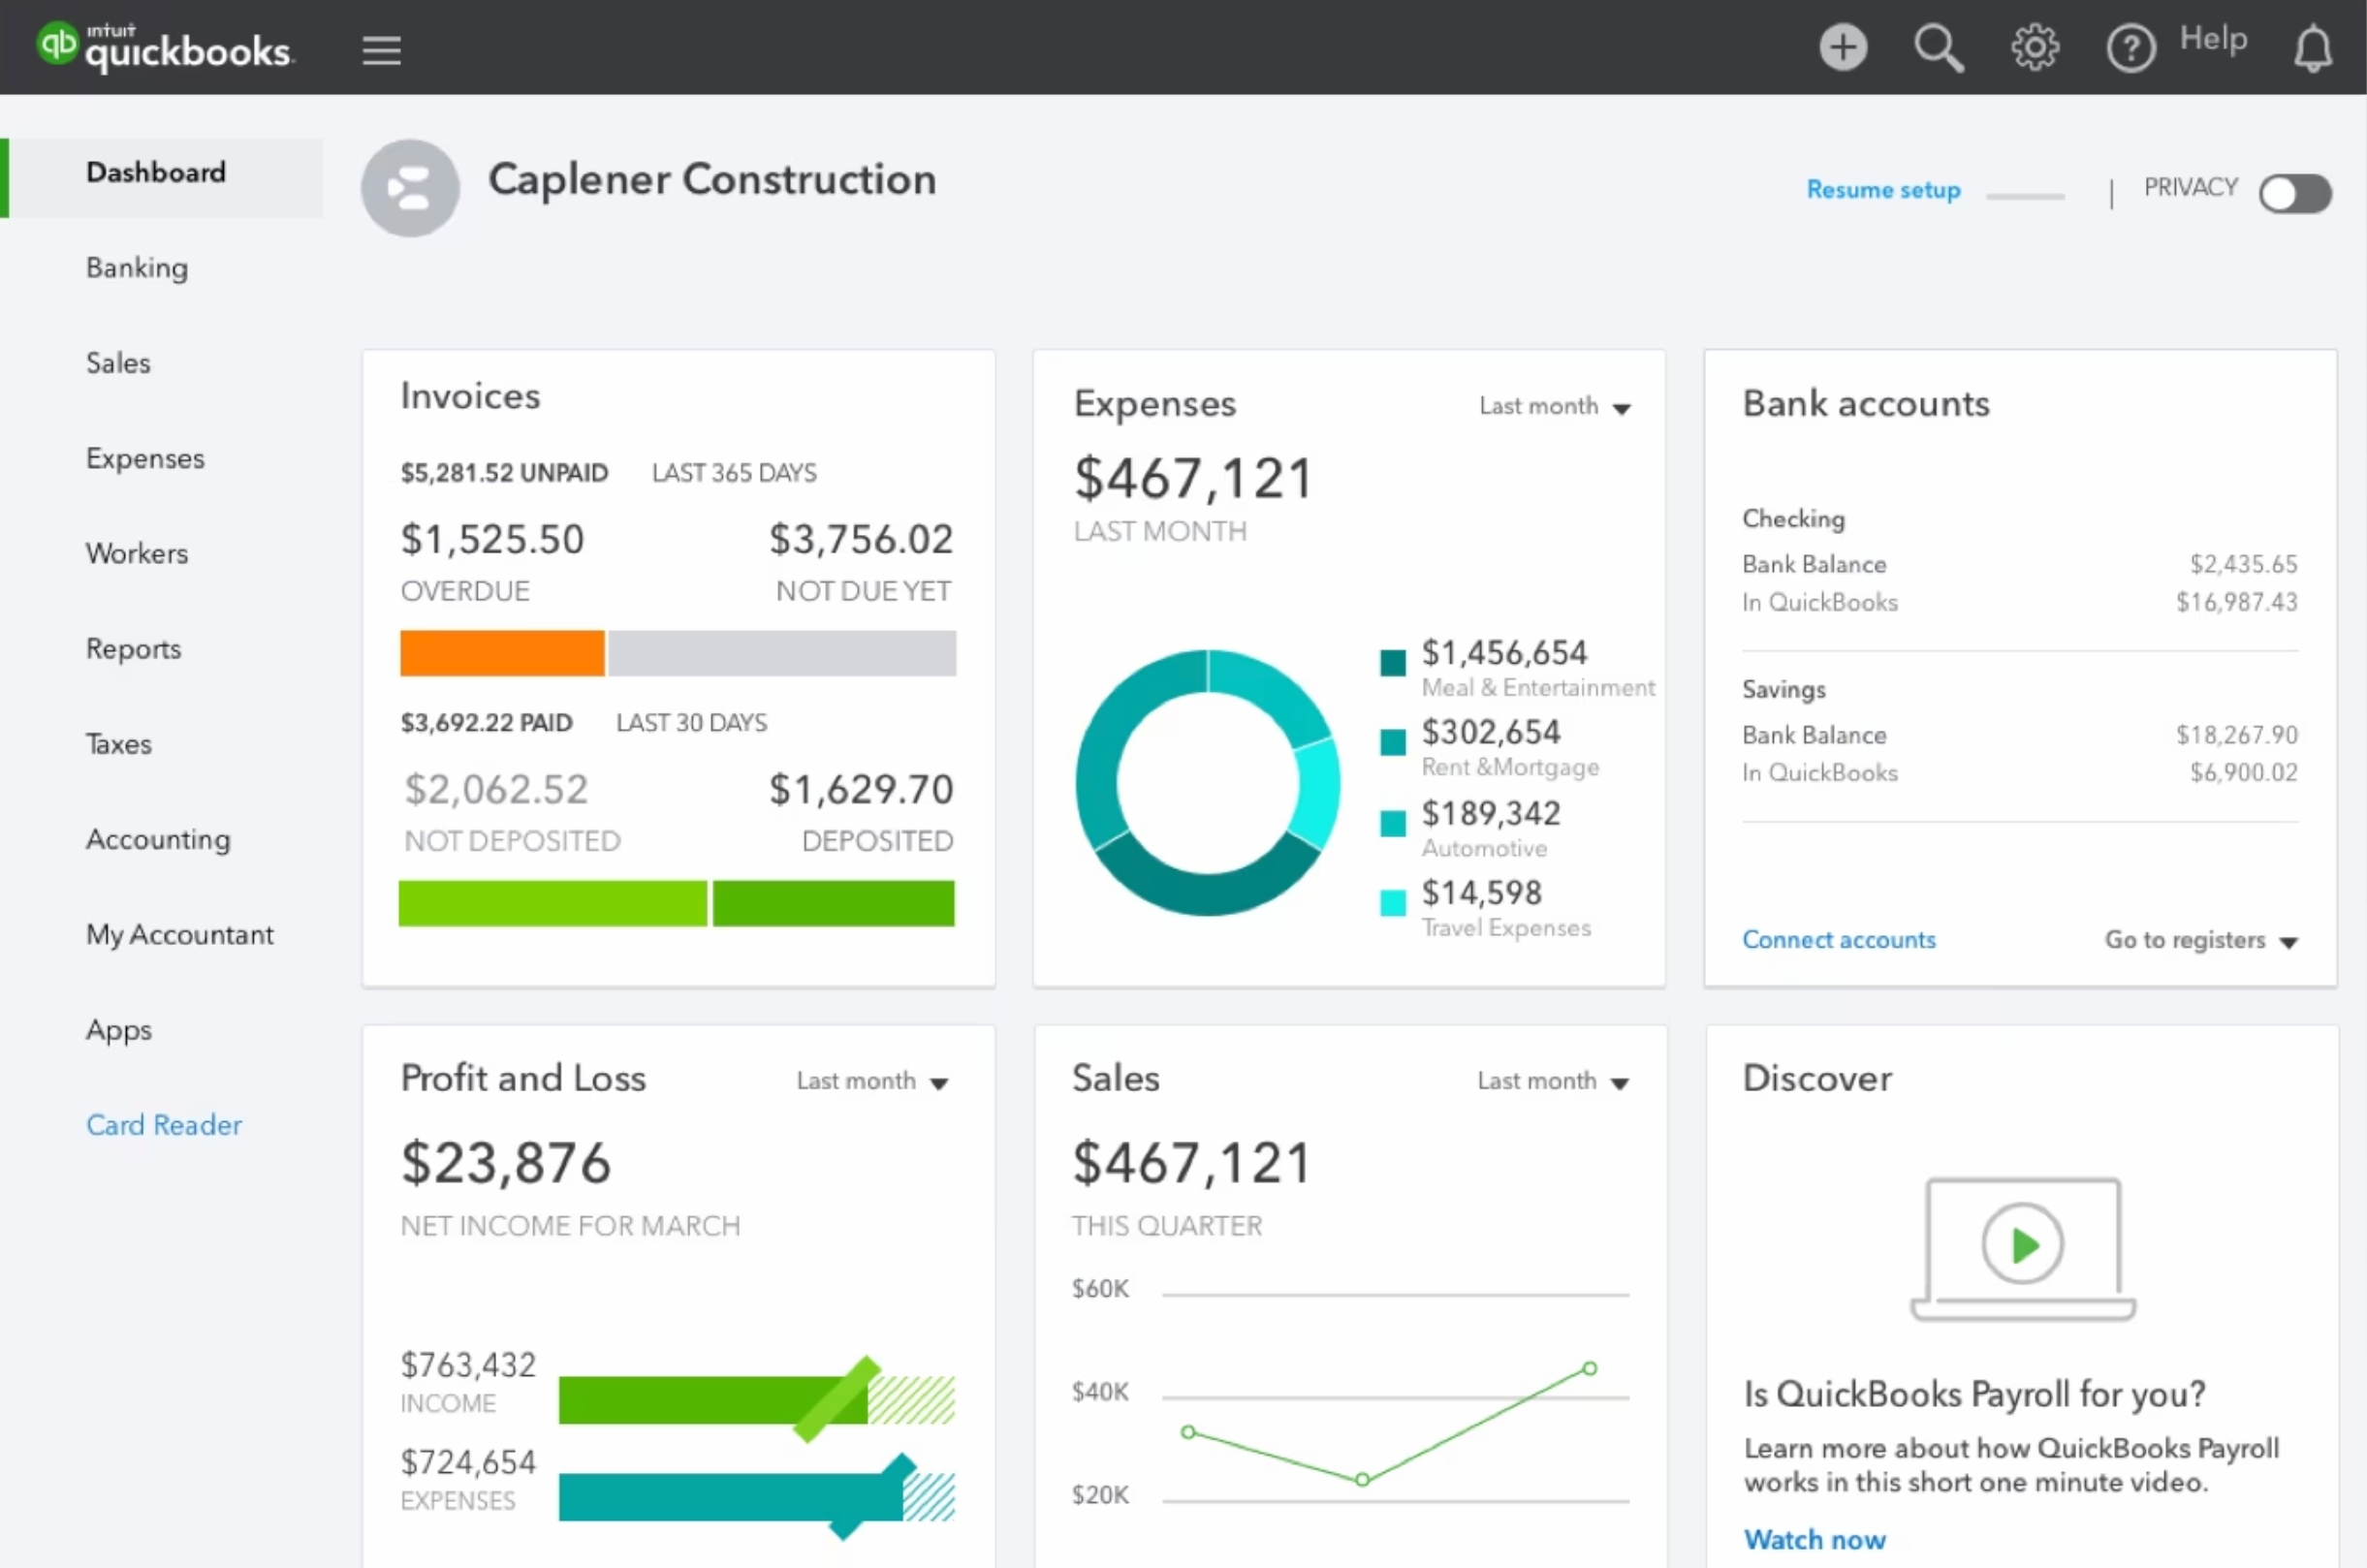
- Automatic sales tax calculations are included.
- Bookkeeping automation cuts down on tedious manual work.
- Share your books and reports with your accountant easily.
- Automatically track mileage for reimbursement using the mobile app.
- More than 60 financial reports to choose from.
- Unlimited invoices and bills on each plan.
- Mobile receipt capture on each plan.
- Multiple pricing plans offer scalability as your business grows.
- More expensive than some competitors.
- Each pricing plan limits the number of users.
- Customer support is not well reviewed.
For more information, read our full QuickBooks Online review .
Sage Intacct: Most comprehensive reporting
Sage Intacct offers more than 150 pre-built financial reports to choose from, plus the ability to generate custom reports. This comprehensive financial reporting software tracks both financial and operational data and even allows you to combine data from multiple entities so you can look at the high-level numbers. You can also slice and dice data according to 10 pre-built dimensions or define your own to get granular and enhance your financial reports .
Sage Intacct does not publicly disclose its pricing information. You’ll have to contact their sales team for a custom quote.
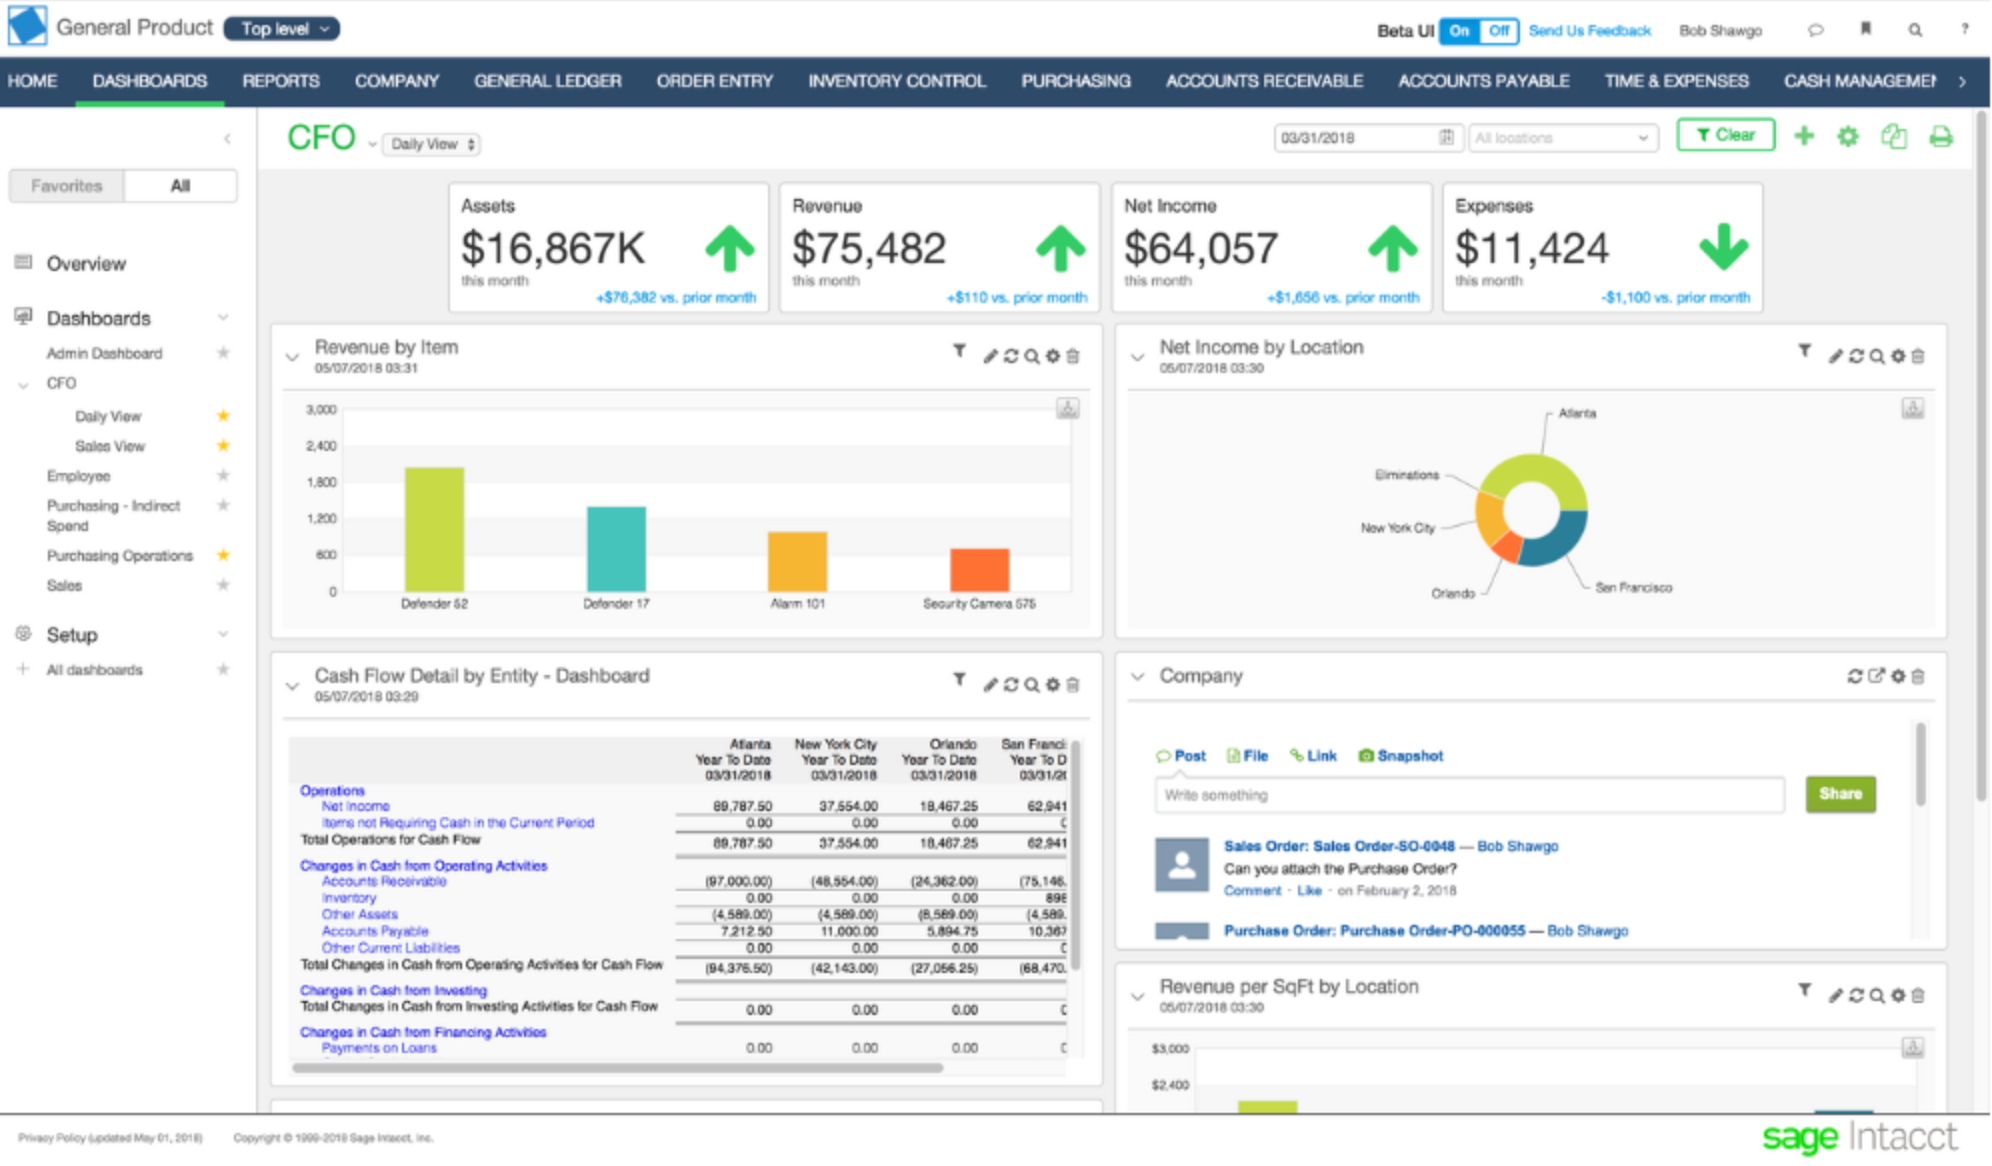
- Create reports, graphs, dashboards and visualizations.
- Multi-entity analytics for complex businesses.
- Intelligent general ledger uses AI to scan for anomalies.
- Add user-dimensions for greater reporting detail.
- Designed for large, multi-entity businesses.
- AI and machine learning features help to automate work.
- Choose from more than 150 pre-built accounting and financial reports.
- Drag-and-drop dashboard creator.
- Pricing is not transparent.
- Learning curve can be steep due to the number of features.
- Too complicated for small businesses.
NetSuite: Best for large enterprises
NetSuite is a full business software stack solution that includes robust options for financial reporting. Since NetSuite was specifically designed for large enterprises, it includes reporting features that support their needs, such as combining financial, operational and statistical data into one report. You can also create custom versions of the same report to present to different audience, so you can highlight different aspects of the same data set.
NetSuite does not publicly disclose its pricing information. You’ll have to contact their sales team for a custom quote.
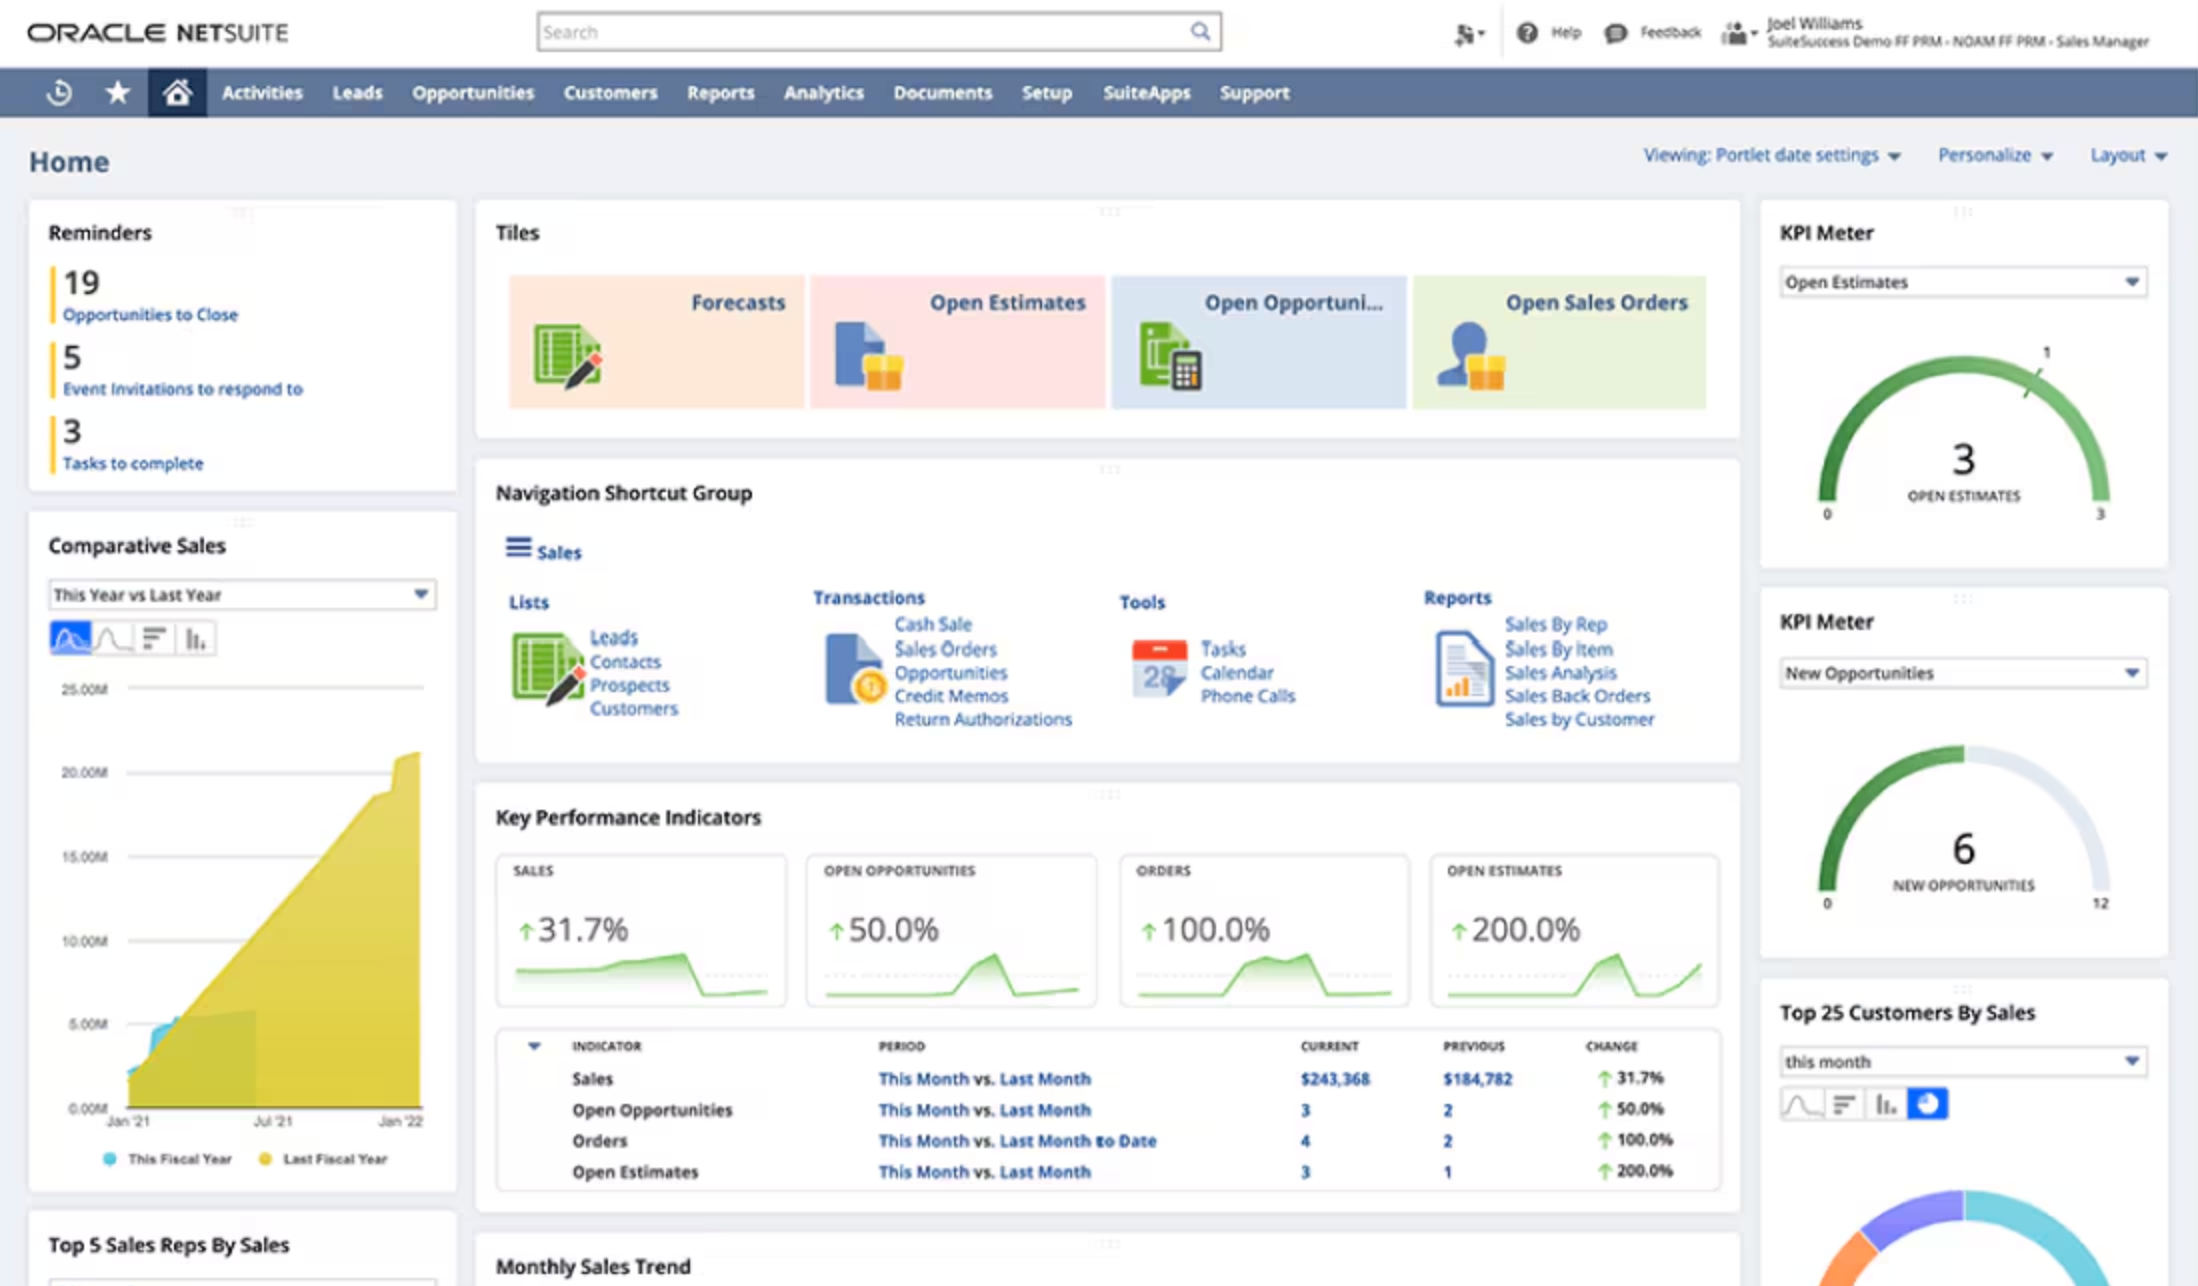
- Create multiple versions of custom reports to show to different audiences.
- Combine financial, operational and statistical data into one report.
- Identify trends as they happen with real-time analytics.
- Gain meaningful insights with industry standard KPIs.
- Comprehensive, complex financial reporting.
- Designed with enterprise needs in mind.
- Many different integrations available.
- Consolidate multiple types of data in one report.
- Higher learning curve.
- Interface can feel outdated compared to competitors.
For more information, read the full NetSuite review .
Xero: Best for small businesses
If you’re a small-business owner looking for simple financial reporting software, Xero is a great option to consider. This accounting software offers a limited selection of default reporting templates, such as profit and loss statements, assets and liabilities, and budget variances.
You can also create your own custom reporting templates and save them for later to make it easy to generate future reports. Xero also provides a good selection of other accounting features, such as invoice creation and expense management .
Xero accounting also three different pricing tiers to choose from:
- Xero Early: $15 per month.
- Xero Growing: $42 per month.
- Xero Established: $78 per month.
Xero also offers a 30-day free trial so that you can test drive the software before committing to a paid plan.
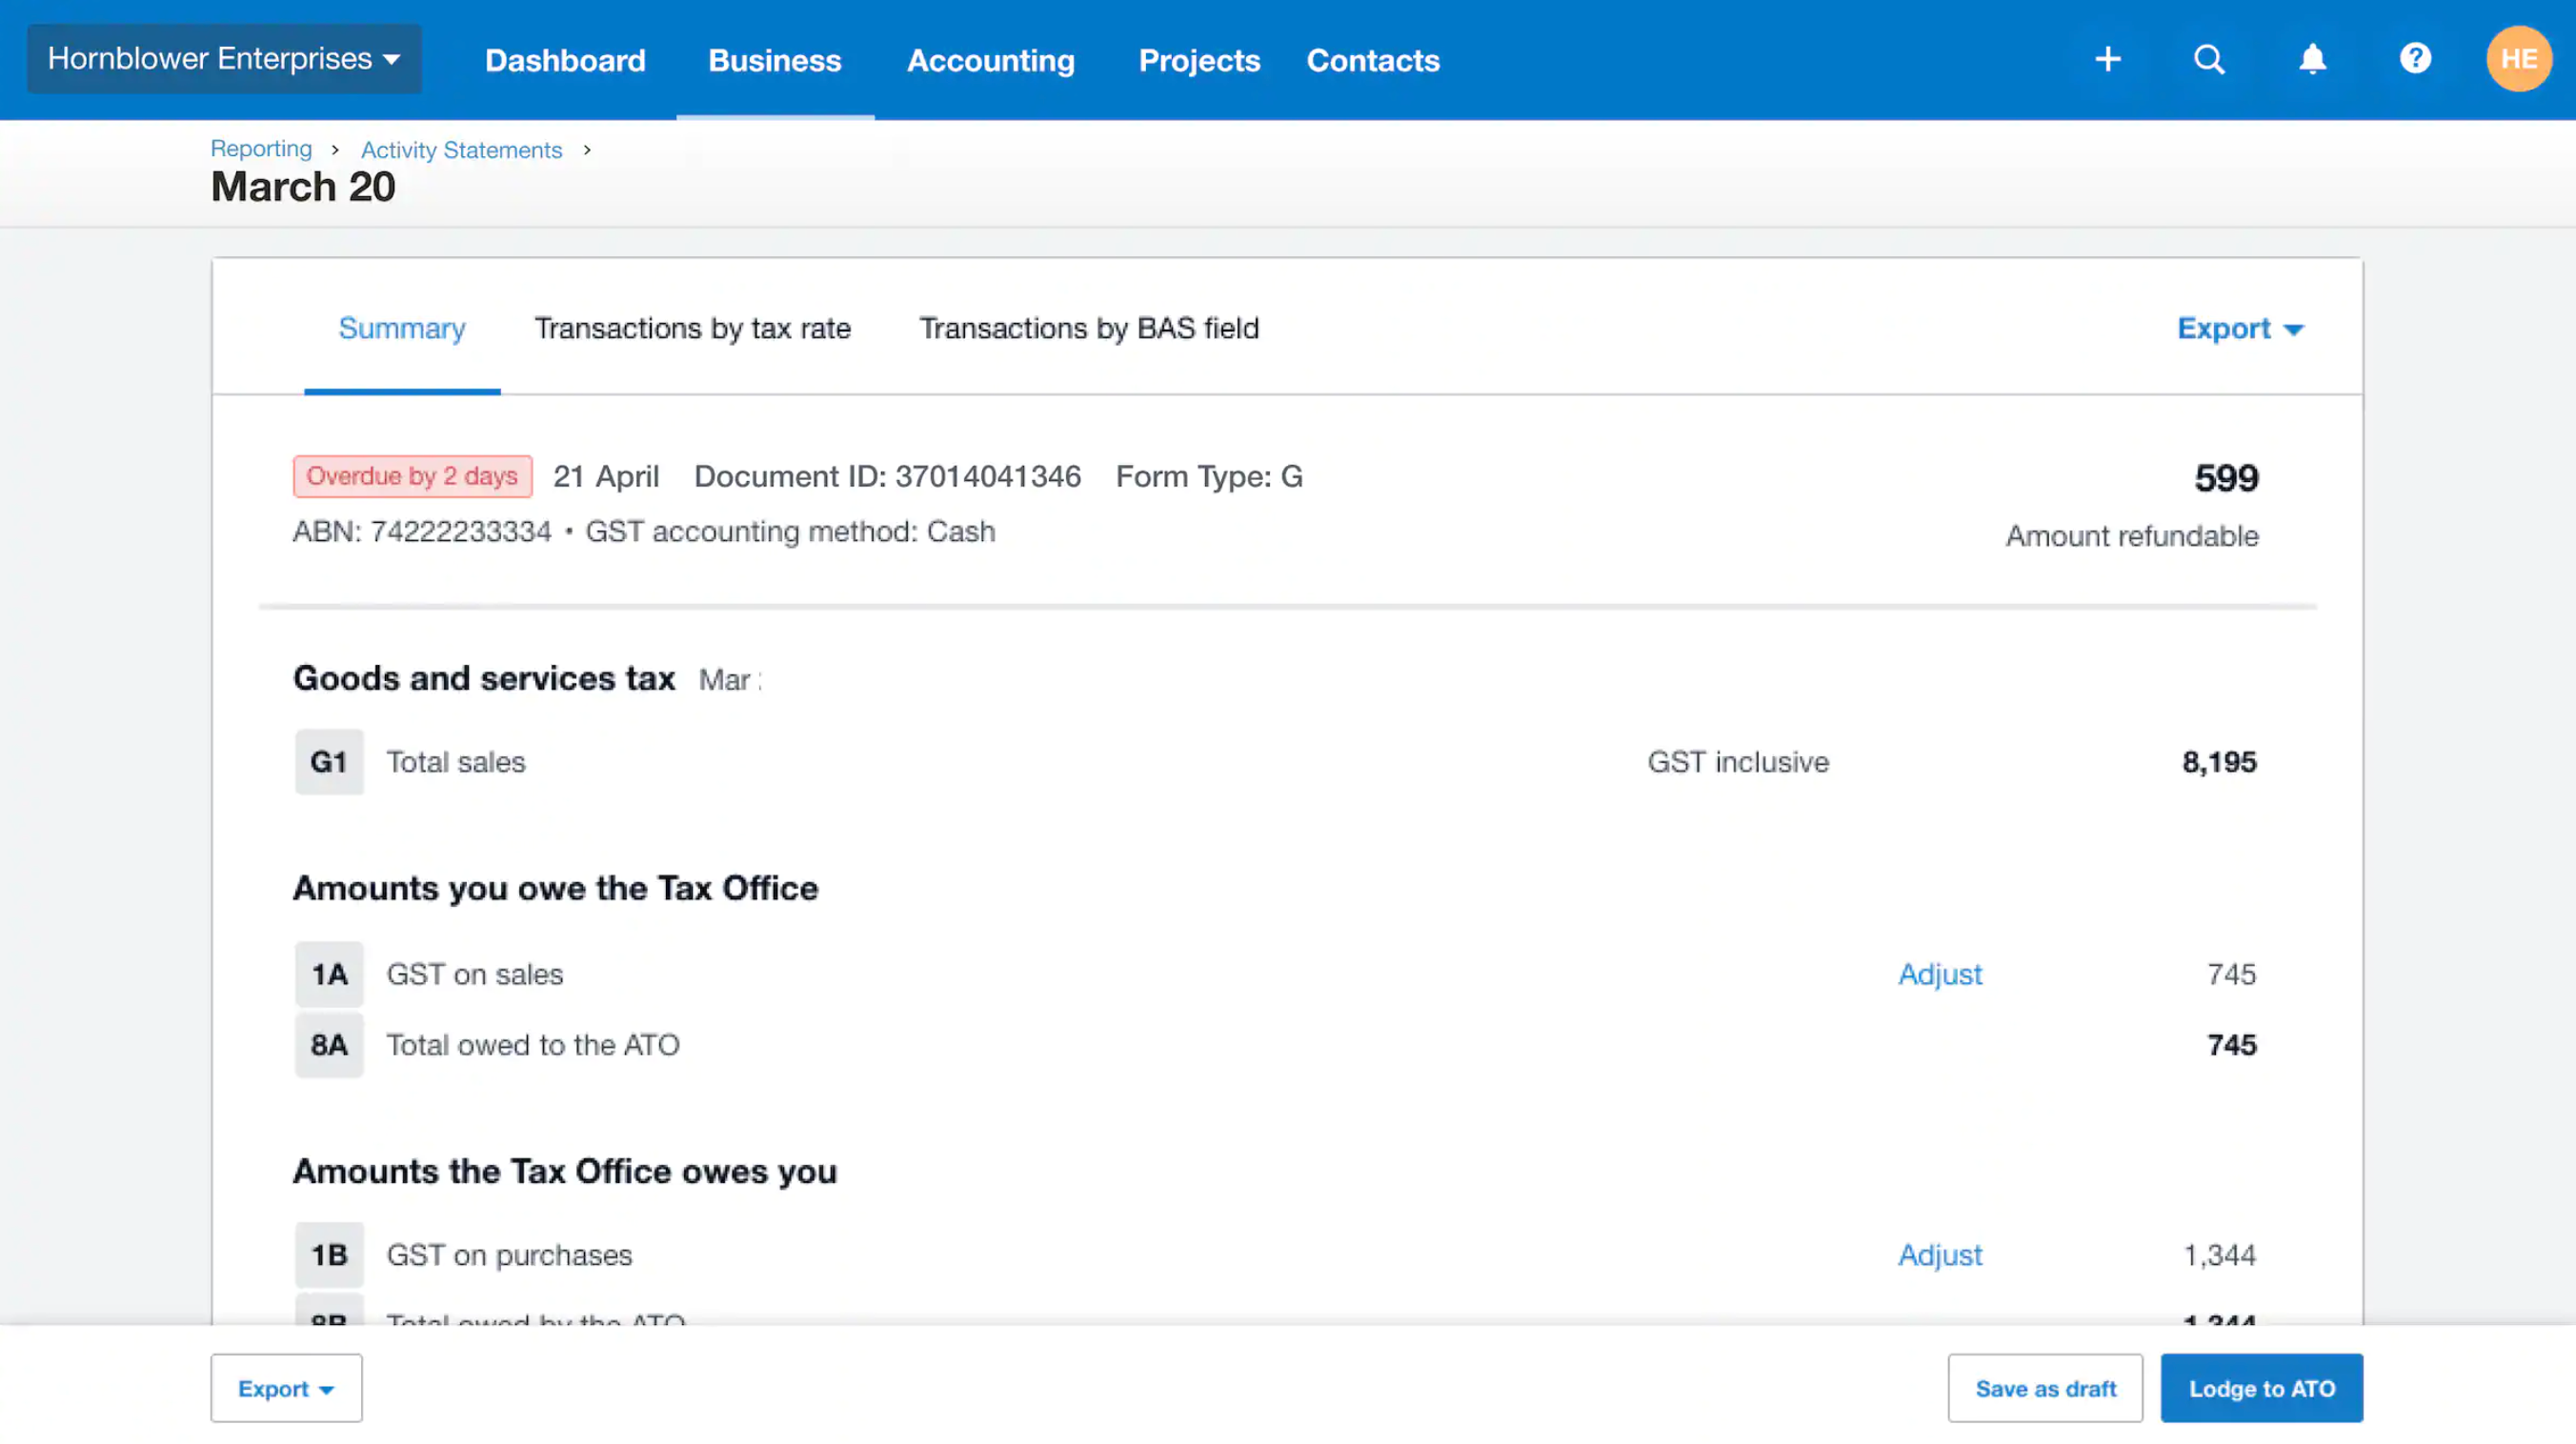
- Expense and mileage tracking available.
- Inventory management available on all pricing plans.
- Create quotes, send invoices and enter bills.
- Sync your bank accounts for automatic tracking and reconciliation.
- Unlimited users on all accounts.
- Affordable pricing plans.
- Low learning curve for beginners.
- Easy to navigate interface.
- Not as many financial reports as some other competitors.
- Must upgrade to Established plan to get many features.
- Invoices and bills are limited on the Early plan.
For more information, read the full Xero review .
Spotlight Reporting: Best add-on tool
If you already have the rest of your business software stack figured out and just need a financial reporting solution, then check out Spotlight Reporting. This advanced reporting software allows you to report on multiple organizations at once, even allowing you to generate consolidated forecast reports. Its robust capabilities mean it offers a higher learning curve, but the trade-off may be worth it if other financial reporting software isn’t complex enough for your needs.
Spotlight Reporting offers three pricing plans targeted towards business owners and Chief Financial Officers:
- Business: $35 per month for one organization, with additional organizations at $25 per month.
- Business 20: $295 per month for up to 20 organizations, with additional organizations at $12.50 per month.
- Franchise + Not For Profit: $295 per month for up to 20 organizations and a head office, and an upgrade is $5 per month per organization.
Spotlight also offers four pricing plans geared towards accountants, bookkeepers and advisors looking for a single license they can use for multiple organizations:
- Basic: $295 per month for up to 20 organizations.
- Super VCFO: $495 per month for up to 50 organizations.
- Super VCFO 150: $995 per month for up to 150 organizations.
- Enterprise: Contact sales team for a custom quote.
A free trial is available for all pricing plans.
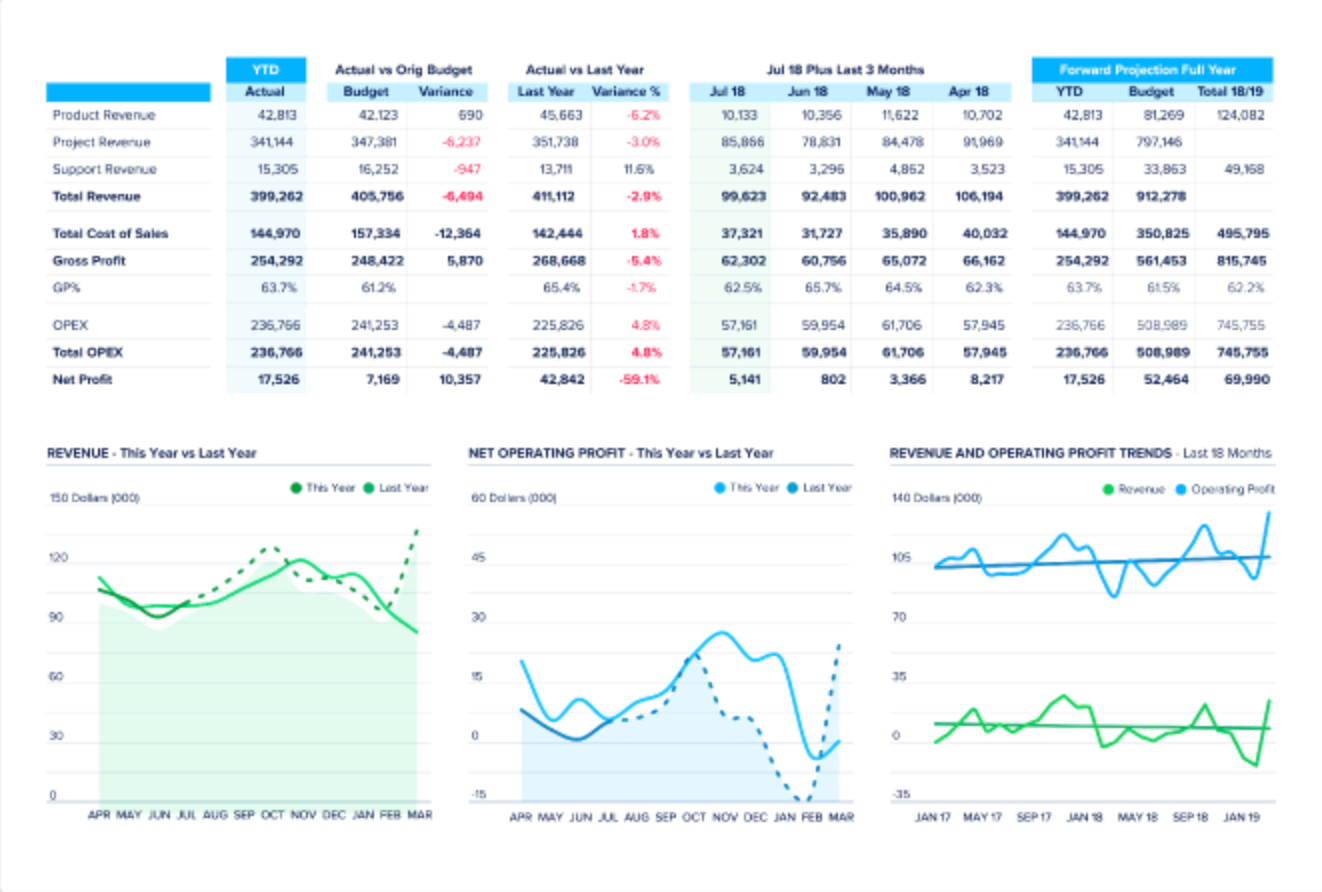
- Easily import data from multiple sources.
- Drag-and-drop interface makes it possible to add and reorder pages.
- Quickly generate multi-page reports to show to clients or management.
- Can email the final report, download a PDF, present it online or publish to the web.
- Advanced reporting features
- More than 100 pre-built charts to choose from.
- Choose from industry-specific templates.
- Can consolidate multiple organizations in one report.
- Reporting only; no extra functionality.
- Higher learning curve due to the more advanced features.
- May be too complex for small businesses.
Zoho Books: Best automations
Zoho Books currently offers 24 accounting and financial reports to choose from, making it a worthy contender for your financial reporting software pick. The reports can be scheduled to automatically sent at specific time intervals and you can also configure role-based access to the reports. Zoho Books also offers four more ways to automate work — workflows, webhooks, email alerts and custom functions — to cut down on repetitive manual tasks.
Zoho Books offers six different pricing plans, which are billed per organization instead of per user. The base pricing plans are:
- Free: $0 for businesses with less than $50K USD per calendar year.
- Standard: $15 per organization per month billed annually, or $20 per organization per month billed monthly.
- Professional: $40 per organization per month billed annually, or $50 per organization per month billed monthly.
- Premium: $60 per organization per month billed annually, or $70 per organization per month billed monthly. A 14-day free trial is available for this plan.
- Elite: $120 per organization per month billed annually, or $150 per organization per month billed monthly.
- Ultimate: $240 per organization per month billed annually, or $275 per organization per month billed monthly.
Zoho Books also offers the following add-ons:
- Additional users: $2.50 per user per month billed annually, or $3 per user per month billed monthly.
- Advanced autoscans: $8 per month for 50 scans per month billed annually, or $10 per more billed monthly.
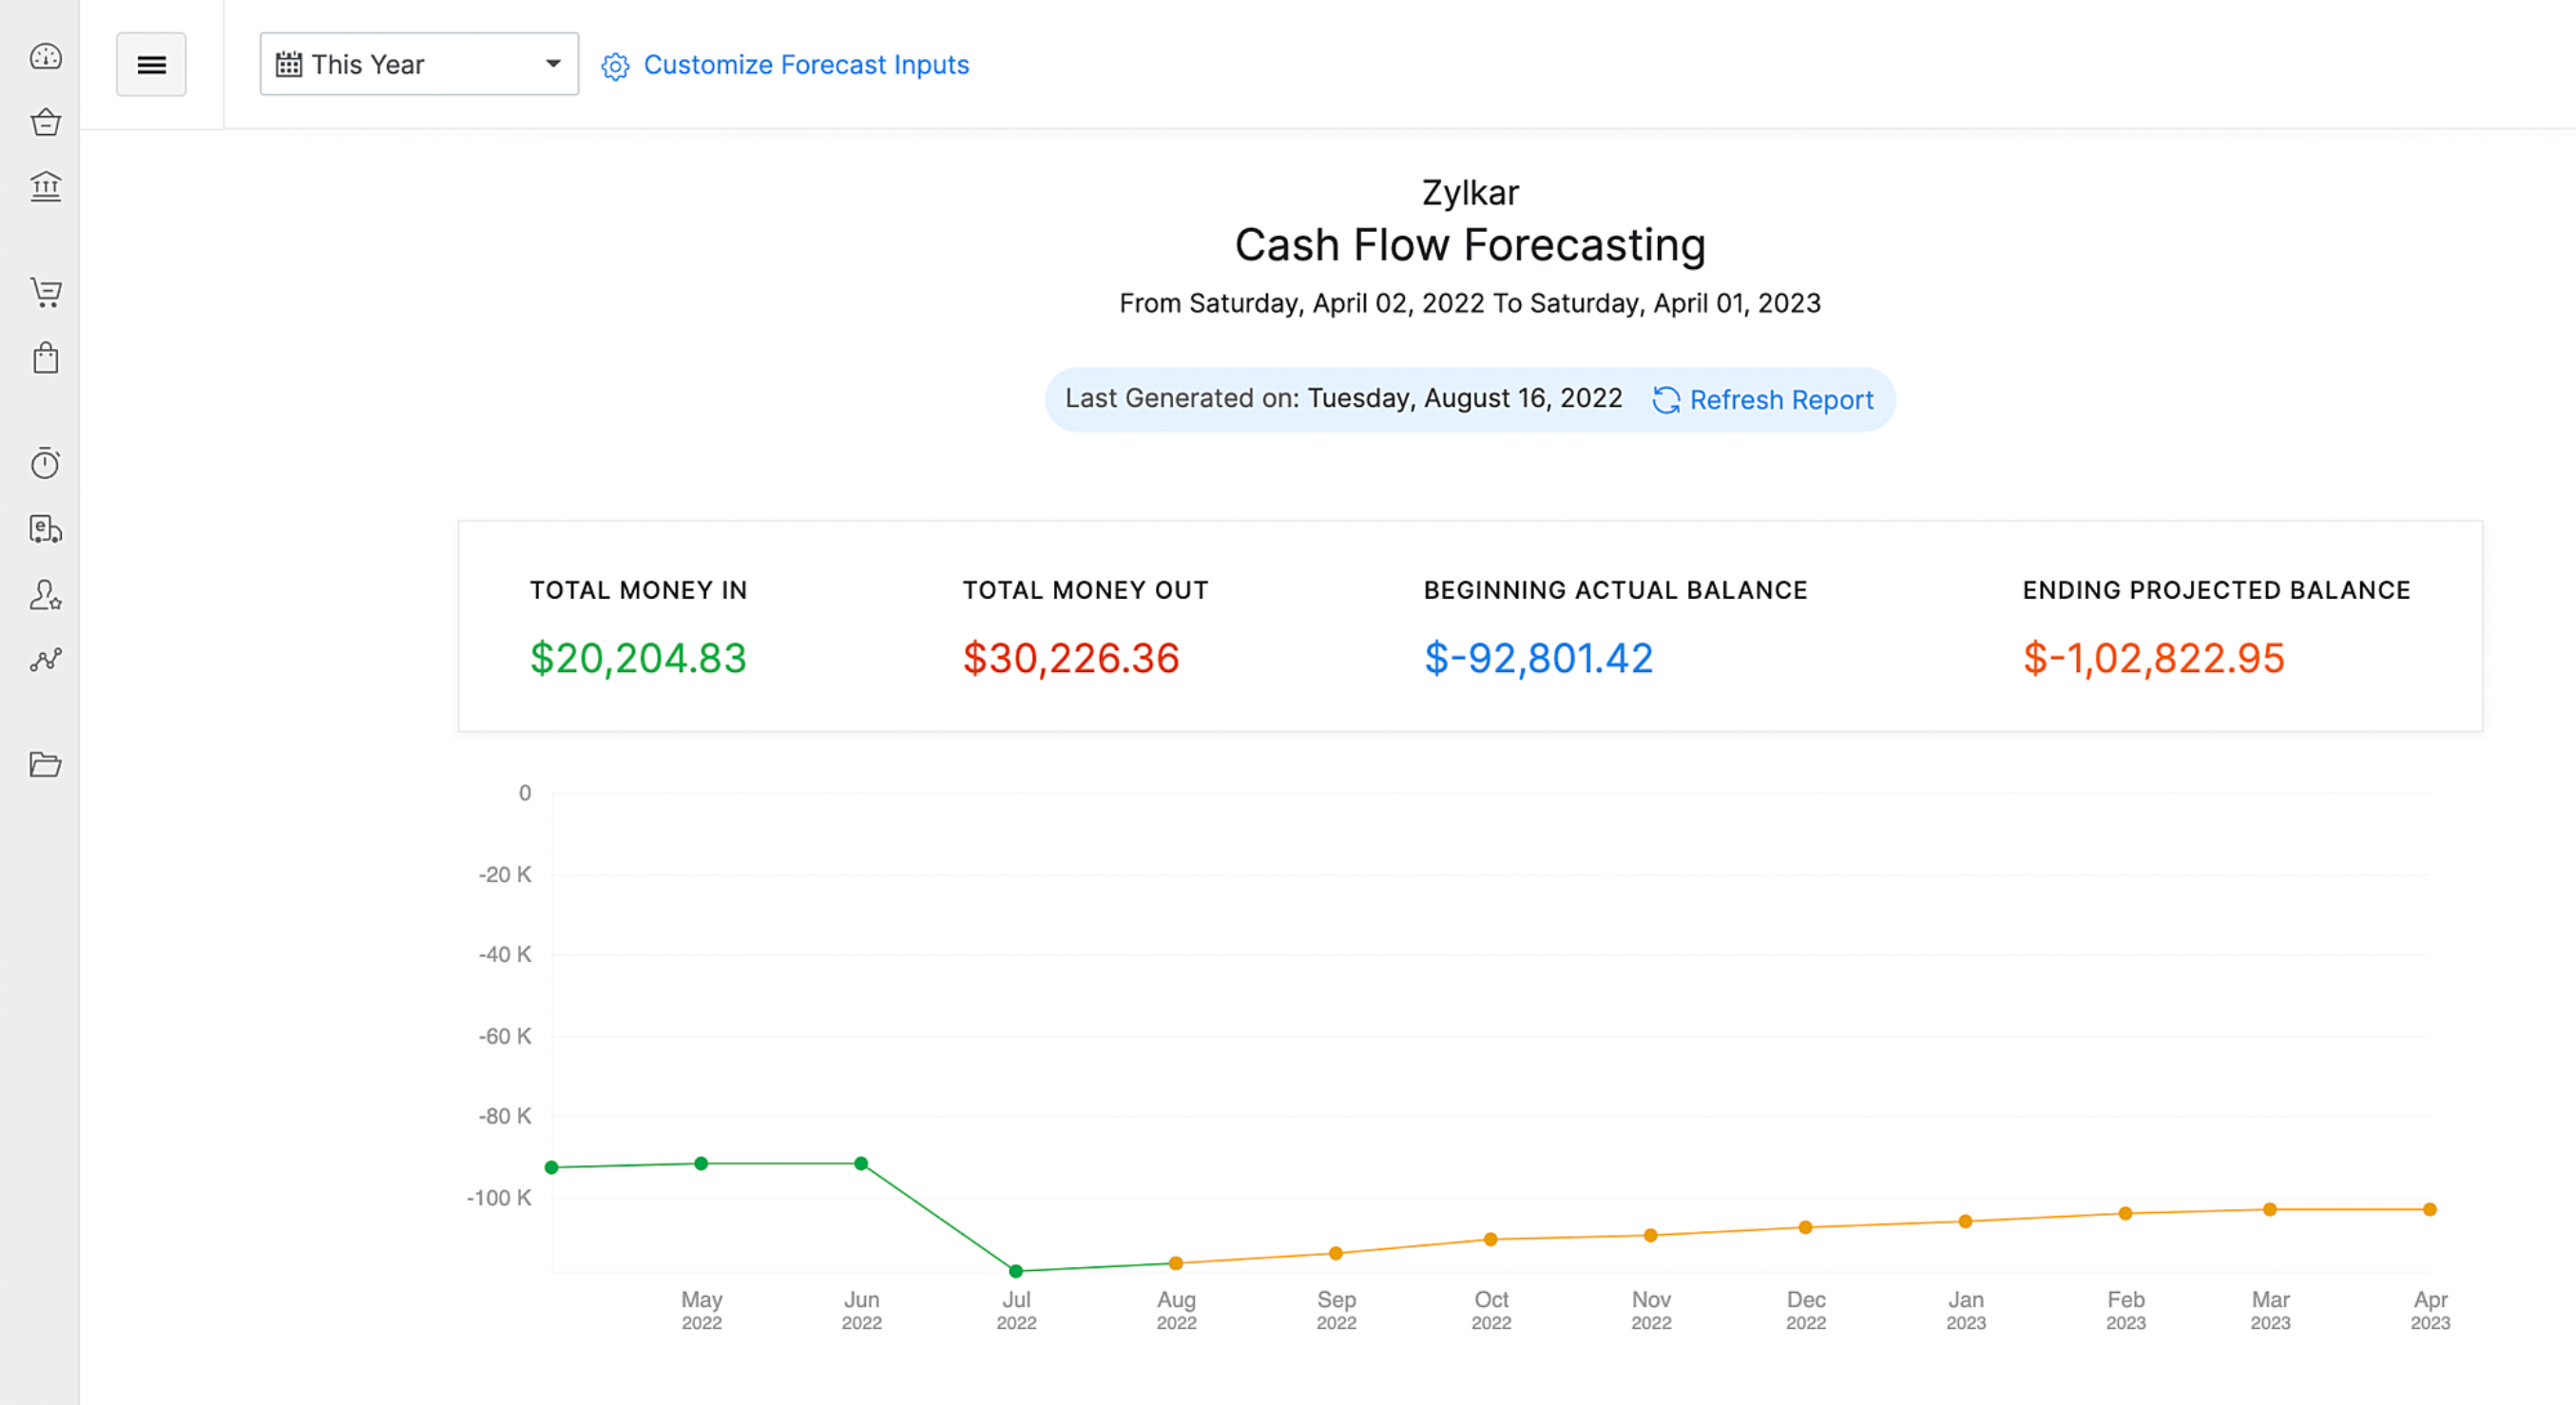
- Double-entry accounting software.
- Generate quotes, invoices and sales orders.
- Simple expense tracking included.
- Client port login makes it easy for them to manage payments.
- Six pricing plans offer excellent scalability.
- Multiple automations to choose from.
- More affordable than many competitors.
- Forever free plan available.
- Requires an outside integration for automatic sales tax calculations.
- Payroll add-on only available in 21 states currently (though access is expanding).
- Must set up free invoicing and inventory add-ons to get full functionality.
For more information, read our full Zoho Books review .
Key features of financial reporting software
Pre-built reports.
The best financial reporting software should already come with a library stocked full of common financial reports, such as profit and loss statements. These pre-built templates make it possible to generate a new report in just a few minutes.
Custom templates
In addition to the pre-built templates, the financial reporting software should also let you create and save your own reporting templates. You should be able to build your own from scratch as well as edit and save existing templates.
Data import
Financial reporting software should integrate with all your data sources, and most come with pre-built connectors to do just that. The software should also give you the option to manually upload data via an Excel sheet or another file format.
Report export
Once the final report is ready, you should be able to share it through multiple avenues. Some of the most common are downloading a PDF and emailing it to colleagues, but some financial reporting software also allows you to publish to the web or present it online.
Forecasting
In addition to generating reports for past data, the best financial reporting software will also be able to create forecasts for the future based on data-driven trends. This helps your business to make evidence-based decisions grounded in data.
How do I choose the best financial reporting software for my business?
To choose the best financial reporting software for your business, consider your needs as well as your budget. A small business will likely be satisfied with a handful of basic reporting templates at a lower price, while enterprises will be willing to pay more for advanced features like multi-entity reporting.
Make a list of your must-have features and prioritize those during your search. If you have a strict budget, you might have to be willing to compromise on some of them to keep costs low. Ask yourself if the lower costs are worth skipping the missing features or having to do time-consuming manual workarounds.
During your search for the best financial reporting software, take advantage of free trials, free accounts and free software demos. For the demo calls, come prepared with specific questions and requirements so you can confirm the software will integrate with the rest of your business software stack.
Methodology
To choose the best ecommerce accounting software, we consulted product documentation, demo videos and user reviews. We evaluated products based on pricing, customer service, user interface design and scalability. We also considered features such as reporting templates, data import, forecasting and integrations.
Subscribe to the Daily Tech Insider Newsletter
Stay up to date on the latest in technology with Daily Tech Insider. We bring you news on industry-leading companies, products, and people, as well as highlighted articles, downloads, and top resources. You’ll receive primers on hot tech topics that will help you stay ahead of the game. Delivered Weekdays
- 7 Best Accounting Software and Services
- Best Accounting Software for Small Businesses
- QuickBooks Online Review: Features, Pricing and More
- Quick Glossary: Accounting
- Best Software for Businesses and End Users
Create a TechRepublic Account
Get the web's best business technology news, tutorials, reviews, trends, and analysis—in your inbox. Let's start with the basics.
* - indicates required fields
Sign in to TechRepublic
Lost your password? Request a new password
Reset Password
Please enter your email adress. You will receive an email message with instructions on how to reset your password.
Check your email for a password reset link. If you didn't receive an email don't forgot to check your spam folder, otherwise contact support .
Welcome. Tell us a little bit about you.
This will help us provide you with customized content.
Want to receive more TechRepublic news?
You're all set.
Thanks for signing up! Keep an eye out for a confirmation email from our team. To ensure any newsletters you subscribed to hit your inbox, make sure to add [email protected] to your contacts list.

- Global (EN)
- Albania (en)
- Algeria (fr)
- Argentina (es)
- Armenia (en)
- Australia (en)
- Austria (de)
- Austria (en)
- Azerbaijan (en)
- Bahamas (en)
- Bahrain (en)
- Bangladesh (en)
- Barbados (en)
- Belgium (en)
- Belgium (nl)
- Bermuda (en)
- Bosnia and Herzegovina (en)
- Brasil (pt)
- Brazil (en)
- British Virgin Islands (en)
- Bulgaria (en)
- Cambodia (en)
- Cameroon (fr)
- Canada (en)
- Canada (fr)
- Cayman Islands (en)
- Channel Islands (en)
- Colombia (es)
- Costa Rica (es)
- Croatia (en)
- Cyprus (en)
- Czech Republic (cs)
- Czech Republic (en)
- DR Congo (fr)
- Denmark (da)
- Denmark (en)
- Ecuador (es)
- Estonia (en)
- Estonia (et)
- Finland (fi)
- France (fr)
- Georgia (en)
- Germany (de)
- Germany (en)
- Gibraltar (en)
- Greece (el)
- Greece (en)
- Hong Kong SAR (en)
- Hungary (en)
- Hungary (hu)
- Iceland (is)
- Indonesia (en)
- Ireland (en)
- Isle of Man (en)
- Israel (en)
- Ivory Coast (fr)
- Jamaica (en)
- Jordan (en)
- Kazakhstan (en)
- Kazakhstan (kk)
- Kazakhstan (ru)
- Kuwait (en)
- Latvia (en)
- Latvia (lv)
- Lebanon (en)
- Lithuania (en)
- Lithuania (lt)
- Luxembourg (en)
- Macau SAR (en)
- Malaysia (en)
- Mauritius (en)
- Mexico (es)
- Moldova (en)
- Monaco (en)
- Monaco (fr)
- Mongolia (en)
- Montenegro (en)
- Mozambique (en)
- Myanmar (en)
- Namibia (en)
- Netherlands (en)
- Netherlands (nl)
- New Zealand (en)
- Nigeria (en)
- North Macedonia (en)
- Norway (nb)
- Pakistan (en)
- Panama (es)
- Philippines (en)
- Poland (en)
- Poland (pl)
- Portugal (en)
- Portugal (pt)
- Romania (en)
- Romania (ro)
- Saudi Arabia (en)
- Serbia (en)
- Singapore (en)
- Slovakia (en)
- Slovakia (sk)
- Slovenia (en)
- South Africa (en)
- Sri Lanka (en)
- Sweden (sv)
- Switzerland (de)
- Switzerland (en)
- Switzerland (fr)
- Taiwan (en)
- Taiwan (zh)
- Thailand (en)
- Trinidad and Tobago (en)
- Tunisia (en)
- Tunisia (fr)
- Turkey (en)
- Turkey (tr)
- Ukraine (en)
- Ukraine (ru)
- Ukraine (uk)
- United Arab Emirates (en)
- United Kingdom (en)
- United States (en)
- Uruguay (es)
- Uzbekistan (en)
- Uzbekistan (ru)
- Venezuela (es)
- Vietnam (en)
- Vietnam (vi)
- Zambia (en)
- Zimbabwe (en)
- Financial Reporting View
- Women's Leadership
- Corporate Finance
- Board Leadership
- Executive Education
Fresh thinking and actionable insights that address critical issues your organization faces.
- Insights by Industry
- Insights by Topic
KPMG's multi-disciplinary approach and deep, practical industry knowledge help clients meet challenges and respond to opportunities.
- Advisory Services
- Audit Services
- Tax Services
Services to meet your business goals
Technology Alliances
KPMG has market-leading alliances with many of the world's leading software and services vendors.
Helping clients meet their business challenges begins with an in-depth understanding of the industries in which they work. That’s why KPMG LLP established its industry-driven structure. In fact, KPMG LLP was the first of the Big Four firms to organize itself along the same industry lines as clients.
- Our Industries
How We Work
We bring together passionate problem-solvers, innovative technologies, and full-service capabilities to create opportunity with every insight.
- What sets us apart
Careers & Culture
What is culture? Culture is how we do things around here. It is the combination of a predominant mindset, actions (both big and small) that we all commit to every day, and the underlying processes, programs and systems supporting how work gets done.
Relevant Results
Sorry, there are no results matching your search..
- Topic Areas
- Reference Library
Q1 2024 Quarterly Outlook
Issues & Trends | March 2024
Our quarterly update on accounting and financial reporting developments, including SEC matters and FASB activity.

KPMG reports on major accounting and financial reporting developments that could affect companies in the current period or near term. This quarter we feature the new SEC climate rule, the PCAOB’s proposal on noncompliance with laws and regulations, and other recent SEC and FASB developments.
Applicability.
- All companies
Key impacts
For Q1 2024:
- The SEC issued its long-awaited climate rule that significantly expands the climate reporting required by registrants. This includes new financial statement disclosures and, in a separate section of the annual report, climate risk disclosures and greenhouse gas emissions.
- The SEC issued its special purpose acquisition company (SPAC) rules that impact all stages of the SPAC lifecycle and better align the disclosure requirements for SPAC IPOs and de-SPAC transactions with traditional IPOs.
- Companies are implementing the SEC’s new compensation clawback rules but are raising questions about how to apply the new recovery policies.
- The PCAOB hosted a public roundtable about its proposal on noncompliance with laws and regulations (NOCLAR) and briefly reopened the related comment period.
- The FASB continues to address its technical agenda, making headway on its disaggregation of income statement expenses and environmental credit programs projects and targeting a final ASU on profits interest awards before quarter close.
Report contents
- Current quarter financial reporting matters
- New standards and guidance
- Projects and agenda priorities
- Recommended reading and CPE opportunities
Download the document:
Explore more.

KPMG professionals discuss this quarter’s accounting and financial reporting headlines

Quarterly Outlook
Quarterly updates on accounting and financial reporting developments, including SEC matters and FASB activity.

Environmental, Social and Governance (ESG) reporting
KPMG guidance and articles for financial reporting professionals.

SEC matters
Keeping you up to date about SEC staff positions on reporting matters and proposed rulemaking that will affect registrants
Meet our team

Subscribe to stay informed
Receive the latest financial reporting and accounting updates with our newsletters and more delivered to your inbox.
Choose your subscription (select all that apply)
By submitting, you agree that KPMG LLP may process any personal information you provide pursuant to KPMG LLP's Privacy Statement .
Accounting Research Online
Access our accounting research website for additional resources for your financial reporting needs.
Thank you for contacting KPMG. We will respond to you as soon as possible.
Contact KPMG
Job seekers
Visit our careers section or search our jobs database.
Use the RFP submission form to detail the services KPMG can help assist you with.
Office locations
International hotline
You can confidentially report concerns to the KPMG International hotline
Press contacts
Do you need to speak with our Press Office? Here's how to get in touch.

IMAGES
VIDEO
COMMENTS
From Management reports, select the Action dropdown for a report, then select Edit. You can change the Template name or the Report period on the screen that appears. Other options are in different sections you can select from the side panel. Cover style: Select a prebuilt style for your cover page.
Learn how to create a customised reporting package with cover page, executive summary, reports and notes using QuickBooks Online Management Reports. Save time and impress your clients with a professional and eye-catching report package.
Run reports in QuickBooks Online. by QuickBooks• 908•Updated January 31, 2024. Manage billing, payment, and subscription info in QuickBooks Online. by QuickBooks• 5102•Updated 3 weeks ago. Add accountant users in QuickBooks Online. by QuickBooks• 5383•Updated January 23, 2024. Enter and manage expenses in QuickBooks Online.
Management reports in QuickBooks Online. Management reports are more of a feature than a new type of report. Basically, it allows you to format any of the existing reports into a good-looking PDF template, with a cover page, executive summary, and other beautiful components. You can also add notes to the file.
Running reports is one of the most powerful things you can do in QuickBooks to see how your business is performing. Let's go over the Reports Center in Quick...
Learn about Customizing Management Reports in Intuit QuickBooks Online with the complete ad-free training course here: https://www.teachucomp.com/courses/int...
The different "flavors" of custom reports in QuickBooks Online. In the Reports section of your QuickBooks Online Dashboard, you'll see that reporting is divided into three general categories: ... Management Reports: Groups of reports that have a cover page, table of contents, and space for opening commentary and endnotes. There are 3 ...
One of the most powerful things you can do in QuickBooks Desktop is run reports to see how your business is performing. Let's go over how to run two of the m...
To use the Management Reports feature in QuickBooks Online, click Reports in the left menu, followed by the Management Reports tab. There you will see three pre-defined sets of Management Reports you can use as-is or customize them. Next, clicking View on the Company Overview report allows you to examine this report's content, as pictured in ...
4 Chapter 11 • Custom Reports—this tab includes a list of reports that you've customized and saved for future use. This tab also includes any reports that other users in your company have customized and shared with you. • Management Reports—QuickBooks Online Management Reports feature allows you to customize a professional looking group of reports complete with cover page, table of
A user asks how to update the captions in a management report financial in QuickBooks Online. A moderator and a team member reply with instructions and resources on how to edit and customize reports in QBO.
7) Management Reporting System Functionalities. 8) Best Practices Summary. Management reporting is a source of business intelligence that helps business leaders make more accurate, data-driven decisions. But, these reports are only as useful as the work that goes into preparing and presenting them. In this blog post, we're going to give a bit ...
6 Chapter 11 Supplier List 1. In the Report centre, click All Reports. 2. Click Review Expenses and Purchases. 3. Click Supplier Contact List. NOTE Use the Search field in the Report Centre to access other lists. You can search for Classes, Recurring Templates, etc. Summary Reports vs. Detail Reports There are two main types of reports in QuickBooks-Summary reports and Detail Reports.
QuickBooks® Management Reports for the Retail Industry - Grade: D+. In service businesses and nonprofits, you are managing people and projects. In manufacturing, you're managing raw materials. With retail, you're managing inventory turnover. You manage sales day by day and look at how things are selling during different periods of time.
Understanding QuickBooks Bookkeeping Reports. In financial management, QuickBooks bookkeeping reports are indispensable tools that empower businesses to understand their financial landscape comprehensively. These reports go beyond the basic recording of transactions. They offer a detailed and organized presentation of financial data.
QuickBooks Online: Best overall financial reporting software QuickBooks is known for its accounting and bookkeeping software, but it actually offers a very robust library of financial reports as well.
QuickBooks Online has three report categories: standard, custom and management. Any standard report can be customized and saved for future reference as well as shared directly from the application.
Accessing QuickBooks Online Management Reports. To use the Management Reports feature in QuickBooks Online, click Reports in the left menu, followed by the Management Reports tab. There you will see three pre-defined sets of Management Reports you can use as-is or customize them. Next, clicking View on the Company Overview report allows you to ...
Think of property management software this way: accounting software is a one-size-fits-all accounting software, and Breeze is an all-in-one property management solution with robust accounting specifically built for real estate. Many clients and consultants tell us that the lack of a tenant ledger in QuickBooks ends the conversation right then ...
Learn how to view, edit, and send Management Reports in QuickBooks Online. Create presentation worthy reports that combine multiple reports in the same document using Management Reports. You can edit Management Reports to add and reorder the reports, add notes, and more. View the different Manageme...
On 27 May 2021, Moscow City placed the first green subfederal bond issue worth 70 billion roubles on MOEX's Sustainability Sector, with BCS Global Markets acting as the Co-Arranger. The 74th Moscow City bond issue worth 70 billion roubles was placed in full, with х1.23 oversubscription after receiving 721 bids with a total size of 86.3 ...
Only a limited number of studies have focused on the LCA of waste management systems in the Russian Federation. The majority of work has been in the form of environmental impact assessments and environmental management reports. A pioneering LCA study was carried out by Tulohonova and Ulanova (2013) for the city of Irkutsk. This work considered ...
This study provides the first life cycle assessment (LCA) for municipal solid waste waste management system in one of the largest cities in Europe, Moscow. Its significance stems from recent important changes in the waste management system, the introduction of limited source separate collection in 2020, and the first examination of sorted municipal solid waste (MSW) composition.
Step 1: Run a report. Go to Reports (Take me there).; Find and open a report. Tip: If you have QuickBooks Online Essentials, Plus, or Advanced, you can also run "Detail" versions of standard reports.; Use the basic filters on the report to adjust things like the report dates. Select Customize.; This opens the customization window.
For Q1 2024: The SEC issued its long-awaited climate rule that significantly expands the climate reporting required by registrants. This includes new financial statement disclosures and, in a separate section of the annual report, climate risk disclosures and greenhouse gas emissions.
Learn how to access and use the ready-made management report templates in QuickBooks Online, such as Company Overview, Sales Performance, and Expenses Performance. Follow the steps and screenshots provided by the QuickBooks Team.
CNN —. Russia has been left reeling in the wake of the nation's worst terrorist attack in decades. ISIS has claimed responsibility for the massacre, which saw armed assailants storm a popular ...
Financial reports give you snapshots of different areas of your business. Most reports are available for all QuickBooks Online users. Some, however, are only available for certain subscription levels. Here's what's available for Simple Start, Essentials, and Plus users. Note: If you have QuickBooks Advanced, you can run all these reports, as ...